Define REST Endpoint
This page describes the process of defining an HTTP endpoint on a REST API data source in the Pirivision Compass module and saving it as a Compass record.
The saved REST endpoint is used in the Cartography module to create chart / KPI widgets.
Prerequisite — Port Data Source
To define this endpoint, a REST API data source must be defined in the Port module. If not already added, go to Port first and define the Base URL and authentication info.
Information Needed Before Definition
The examples on this page use the Demo Factory REST stream's mock endpoints and the Demo Factory - REST data source in Port. To start the endpoints in your own environment, see Synthetic Data Generation — REST API.
| Information | Description | Default | Example |
|---|---|---|---|
| Data Source | REST API connection added in the Port module | — | Demo Factory - REST |
| Endpoint Path | The relative endpoint path under the Base URL | — | /api/sayac/anlik |
| HTTP Method | Request method | GET |
GET |
| Record Name | The name shown in the Compass list | — | Instant Production Counter |
| Target Folder | The Compass folder where the record will be placed | Root | Demo Factory / REST |
Base URL vs Path
Base URL is defined on the data source in the Port module (e.g. http://<server>:1880).
Endpoint path is defined per record in Compass (e.g. /api/sayac/anlik).
Combined: http://<server>:1880/api/sayac/anlik
1. Open the Compass Module
Click Compass in the left menu.
2. Create a New REST Record
Click the Add New Query button at the top right. (The UI shows "Query"; for REST API this action means adding a new endpoint definition to Compass.)
3. Select a REST API Data Source
In the Select Your Data Source screen, choose the data source under the REST API category.
Click Next.
4. The REST Endpoint Form Opens
After selecting the REST API data source, the REST endpoint form opens.
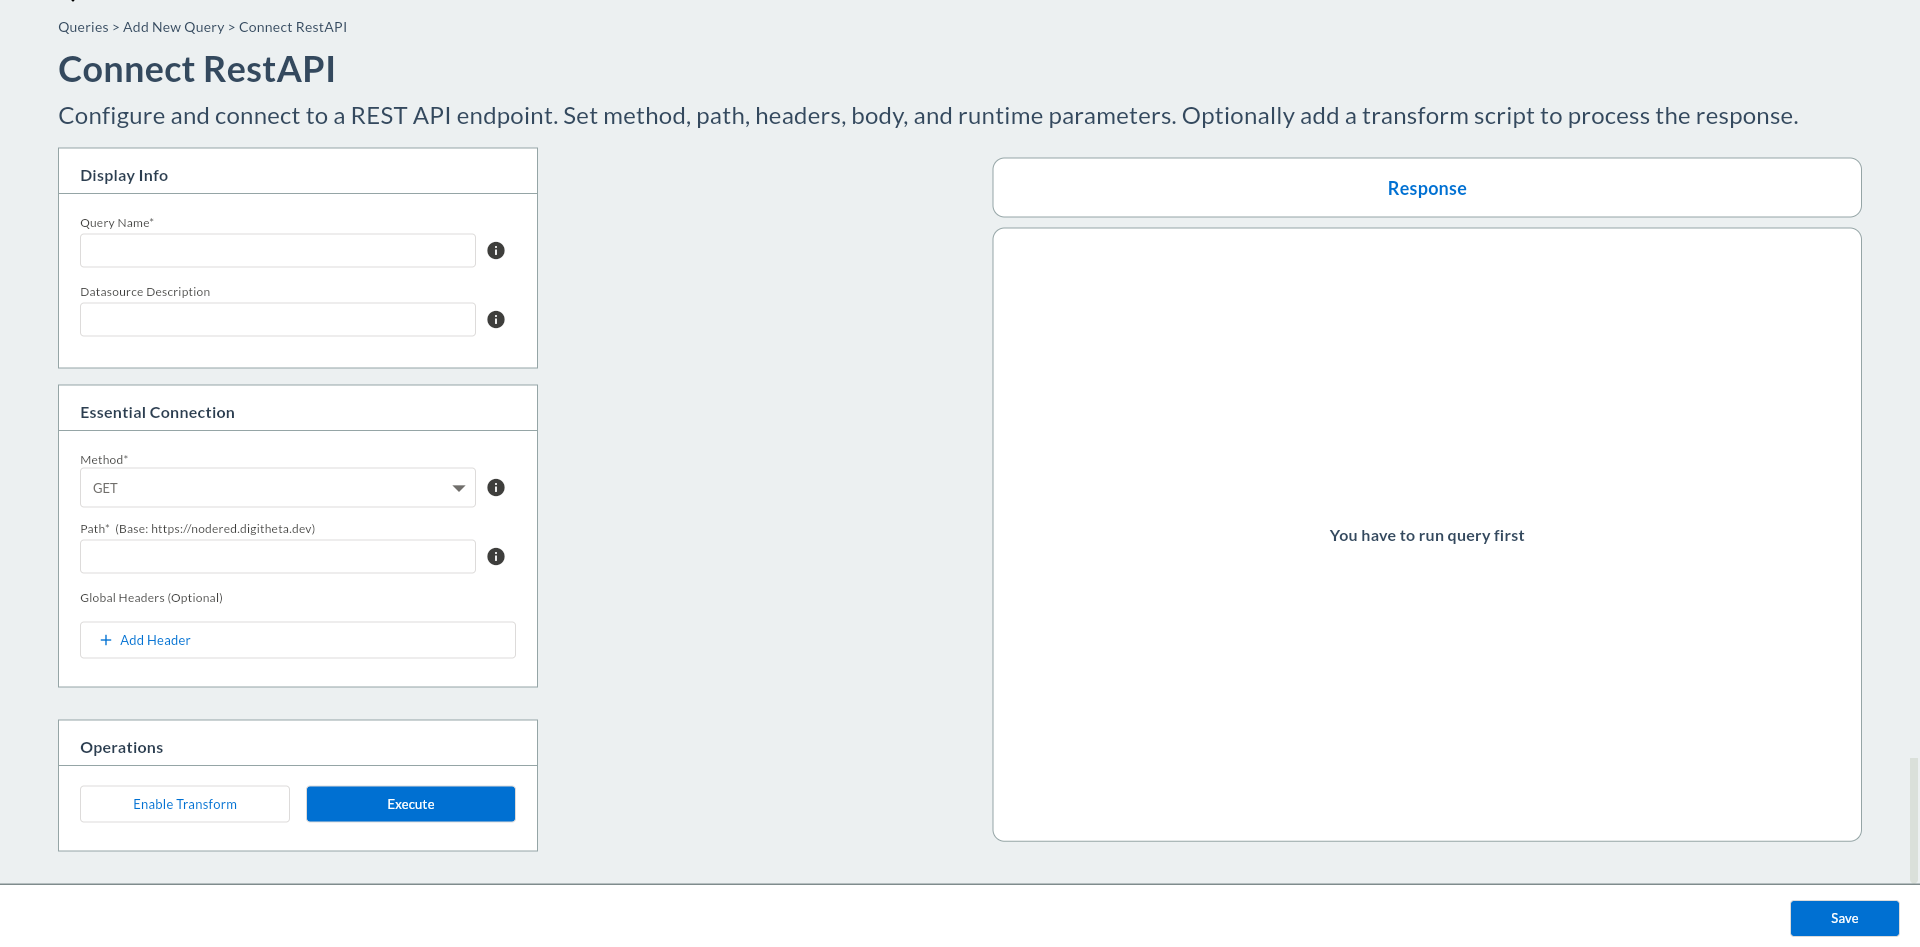
Form sections:
| Section | Description |
|---|---|
| Endpoint Path | The relative path appended to the Base URL |
| HTTP Method | GET / POST |
| Query Parameters | Key-value parameters added to the URL |
| Headers | Endpoint-specific HTTP headers (in addition to Port global headers) |
| Body | Request body for POST requests (JSON / form) |
| Response Preview | Test response preview |
5. Enter the Endpoint Path
Enter the relative path under the Base URL in the Endpoint Path field.
| Field | Required | Description | Default | Example |
|---|---|---|---|---|
| Endpoint Path | Yes | Relative URL path; must start with / |
— | /api/sayac/anlik |
| HTTP Method | Yes | GET or POST | GET |
GET |
Demo Factory endpoints
/api/sayac/anlik, /api/oee/today, /api/vardiya/dun, /api/alarm/son50 — no query parameters.
/api/sicaklik/trend (hat={{hat_id}}, hours={{hours}}), /api/durus/dagilim (gun={{day}}), /api/recete (makine={{makine_id}}) — use query parameters (see below).
6. Add Query Parameters (Optional)
Define key-value parameters added to the URL. (For the Demo Factory, /api/sayac/anlik needs no parameters; /api/sicaklik/trend or /api/recete use them.)
| Field | Required | Description | Default | Example |
|---|---|---|---|---|
| Key | — | Parameter name | — | hat |
| Value | — | Parameter value ({{param}} syntax supported) |
— | {{hat_id}} |
Example (temperature trend): Key: hat → Value: {{hat_id}} and Key: hours → Value: {{hours}}.
You can add a new row with the + Add Parameter button.
Dynamic Parameters
Parameters written with {{param_name}} syntax (e.g. {{hat_id}}, {{makine_id}}) are defined as Global Variables in the save panel and can be bound to dashboard filters. For REST, the value is substituted as a plain string.
7. Add Endpoint-Specific Headers (Optional)
You can define custom headers per endpoint in addition to the Port global headers. (Demo Factory Node-RED mock endpoints do not require authentication headers; this step is for real APIs with authentication.)
| Field | Required | Description | Default | Example |
|---|---|---|---|---|
| Header Key | — | Header name | — | X-Source |
| Header Value | — | Header value ({{param}} supported) |
— | pirivision |
8. Add Transform Code (Optional)
To transform the API response with JavaScript before it reaches Pirivision charts, click Enable Transform in the top-right corner of the form. A code editor opens.
Script Environment
| Variable | Type | Description |
|---|---|---|
data |
object \| array \| null |
The API response, parsed as JSON |
runtimeParams |
object |
Dynamic parameters defined with {{param}} syntax in Compass |
The script must return a value (return is mandatory). Execution is limited to 200 ms; fetch, setTimeout, and I/O access are not supported.
Helper functions:
| Function | Description |
|---|---|
Safe.parseJSON(str) |
Parses JSON; returns null on error |
Safe.toJSON(val) |
JSON.stringify wrapper |
Scenario Examples
Scenario 1 — Pass-through (no transformation needed)
When the API already returns data in the format Pirivision expects, a simple null guard is sufficient.
Scenario 2 — Extract array from a nested object
If the API returns { "result": { "items": [...] } } and the chart only expects the items array:
Scenario 3 — Field projection (specific columns only)
Return only ts, value, and line from each row:
if (!Array.isArray(data)) return data;

return data.map(row => ({
  ts:    row.ts,
  value: row.value,
  line:  row.line,
}));
Scenario 4 — Compute a derived field
If the API returns oee as a 0–1 ratio, convert it to a percentage:
Scenario 5 — Filter an array
Return only active alarm records from an alarm list:
Scenario 6 — Client-side filtering with runtimeParams
When {{line_id}} is defined in Compass, filter server-side data by the selected line in the script:
if (!Array.isArray(data)) return data;

return data.filter(row => row.line === runtimeParams.line_id);
Scenario 7 — Downtime type distribution: add a percentage field
When an endpoint like /api/durus/dagilim returns the following array, add a percentage field to each row so it can be used as a label in a Pie / Doughnut chart:
[
  { "adet": 128, "duris_tipi": "Ayar Değişimi" },
  { "adet": 107, "duris_tipi": "Arıza" },
  { "adet": 98,  "duris_tipi": "Vardiya Devri" },
  { "adet": 79,  "duris_tipi": "Planlı Bakım" },
  { "adet": 29,  "duris_tipi": "Malzeme Bekleme" }
]
if (!Array.isArray(data) || data.length === 0) return data;

var total = data.reduce(function(acc, row) {
  return acc + (row.adet || 0);
}, 0);

return data.map(function(row) {
  return {
    duris_tipi: row.duris_tipi,
    adet:       row.adet,
    percentage: total > 0
                  ? Math.round((row.adet / total) * 1000) / 10  // 1 decimal place
                  : 0,
  };
});
Output: each row contains
duris_tipi,adet, andpercentage(%). In a Pie/Doughnut chart useduris_tipias the category axis andadetorpercentageas the value.
Scenario 8 — Top-N: show only the highest N types
When there are too many downtime types, the chart becomes cluttered. Return only the top N by count:
if (!Array.isArray(data) || data.length === 0) return data;

var n = 3; // how many types to show

return data
  .slice()                                          // copy to avoid mutating the original
  .sort(function(a, b) { return b.adet - a.adet; }) // sort descending
  .slice(0, n);                                     // take the first N
Output:
[ Ayar Değişimi(128), Arıza(107), Vardiya Devri(98) ]— "Planlı Bakım" and "Malzeme Bekleme" are excluded.
Scenario 9 — Bucket low-count types into an "Other" group
Merge types below a threshold count into a single "Other" entry to improve chart readability:
if (!Array.isArray(data) || data.length === 0) return data;

var threshold = 50; // types below this count go into "Other"

var main       = [];
var otherCount = 0;

data.forEach(function(row) {
  if (row.adet >= threshold) {
    main.push(row);
  } else {
    otherCount += row.adet;
  }
});

if (otherCount > 0) {
  main.push({ duris_tipi: "Other", adet: otherCount });
}

return main.sort(function(a, b) { return b.adet - a.adet; });
Output with threshold
50:Ayar Değişimi(128),Arıza(107),Vardiya Devri(98),Planlı Bakım(79),Other(29)— only "Malzeme Bekleme" falls below the threshold and is merged.
If execution time is exceeded
If the script does not complete within 200 ms, a transform timeout/interrupt error is returned. For large arrays, prefer early return over chained filter + map, or move the heavy computation to the API side.
9. Test the Endpoint
Click the Send or Test button.
The request is sent to the actual API and the response is shown below:
| Information | Description |
|---|---|
| HTTP Status Code | 200 OK, 401 Unauthorized, 404 Not Found, etc. |
| Response Time | Response time in milliseconds |
| Response Content | Syntax-highlighted preview in JSON / XML format |
Demo Factory /api/sayac/anlik response
When testing /api/sayac/anlik, a response like this appears (200 OK):
10. Save the Endpoint Record
If the test is successful, click Save at the top right. The save panel opens.
11. Display Info — Name and Description
| Field | Required | Description | Default | Example |
|---|---|---|---|---|
| Name | Yes | Record name shown in the Compass list | — | Instant Production Counter |
| Description | No | Text explaining the purpose of the endpoint | — | Node-RED /api/sayac/anlik mock endpoint — instant production counter |
12. Location — Target Folder
Select the folder via the Target Folder field in the save panel. If not chosen, the record is saved in the root directory.
13. Click the Save Button
Click the Save button at the bottom of the panel.
14. Verify in the List
A new REST endpoint card should appear in the Compass list.
15. Common Errors
| Error / Symptom | Possible Cause | Solution |
|---|---|---|
"could not open target DB: ..." |
REST API data source connection error | Test the REST API connection in the Port module |
HTTP 401 Unauthorized |
API authentication failed | Check the Authorization header value in Port |
HTTP 403 Forbidden |
No access permission | Check API key or token permissions |
HTTP 404 Not Found |
Wrong endpoint path | Verify path; test the Base URL + Path combination |
HTTP 408 / timeout |
Response time exceeded | Increase the Timeout value in Port (default: 5000 ms) |
Demo Factory endpoints return 404 |
Node-RED flow not started | See Synthetic Data Generation — REST API |
| Empty response | API returns no data | Check API documentation; are parameters correct? |
"you already have a query named '...'" |
A Compass record with the same name exists | Choose a different name |
transform error: ... |
Transform script runtime error | Check script syntax and ensure a return statement is present |
transform timeout/interrupt |
Script exceeded 200 ms limit | Filter large data on the API side; simplify the script |
Next Step
After the REST endpoint is saved to Compass, you can create a chart or KPI widget using this record in Cartography.