MQTT Topic Selection
This page describes the process of connecting to an MQTT data source in the Pirivision Compass module, selecting a topic, and storing it as a Compass record.
The saved MQTT topic connection is used in the Cartography module to create real-time gauges, value displays, or live trend widgets.
Prerequisite — Port Data Source
To define this topic, an MQTT data source (broker connection) must be defined in the Port module. If not already added, go to Port first and create an MQTT connection.
Information Needed Before Selection
The examples on this page use the Demo Factory MQTT stream topics and the Demo Factory - MQTT data source in Port. To start the stream in your own environment, see Synthetic Data Generation — MQTT.
| Information | Description | Default | Example |
|---|---|---|---|
| Data Source | MQTT connection added in the Port module | — | Demo Factory - MQTT |
| Topic Path | The MQTT topic path to select | — | fabrika/hat1/sicaklik |
| Record Name | The name shown in the Compass list | — | Line 1 Instant Temperature |
| Target Folder | The Compass folder where the record will be placed | Root | Demo Factory / Sensors |
1. Open the Compass Module
Click Compass in the left menu.
2. Create a New MQTT Record
Click the Add New Query button at the top right. (The UI shows "Query"; for MQTT this action means adding a new topic record to Compass.)
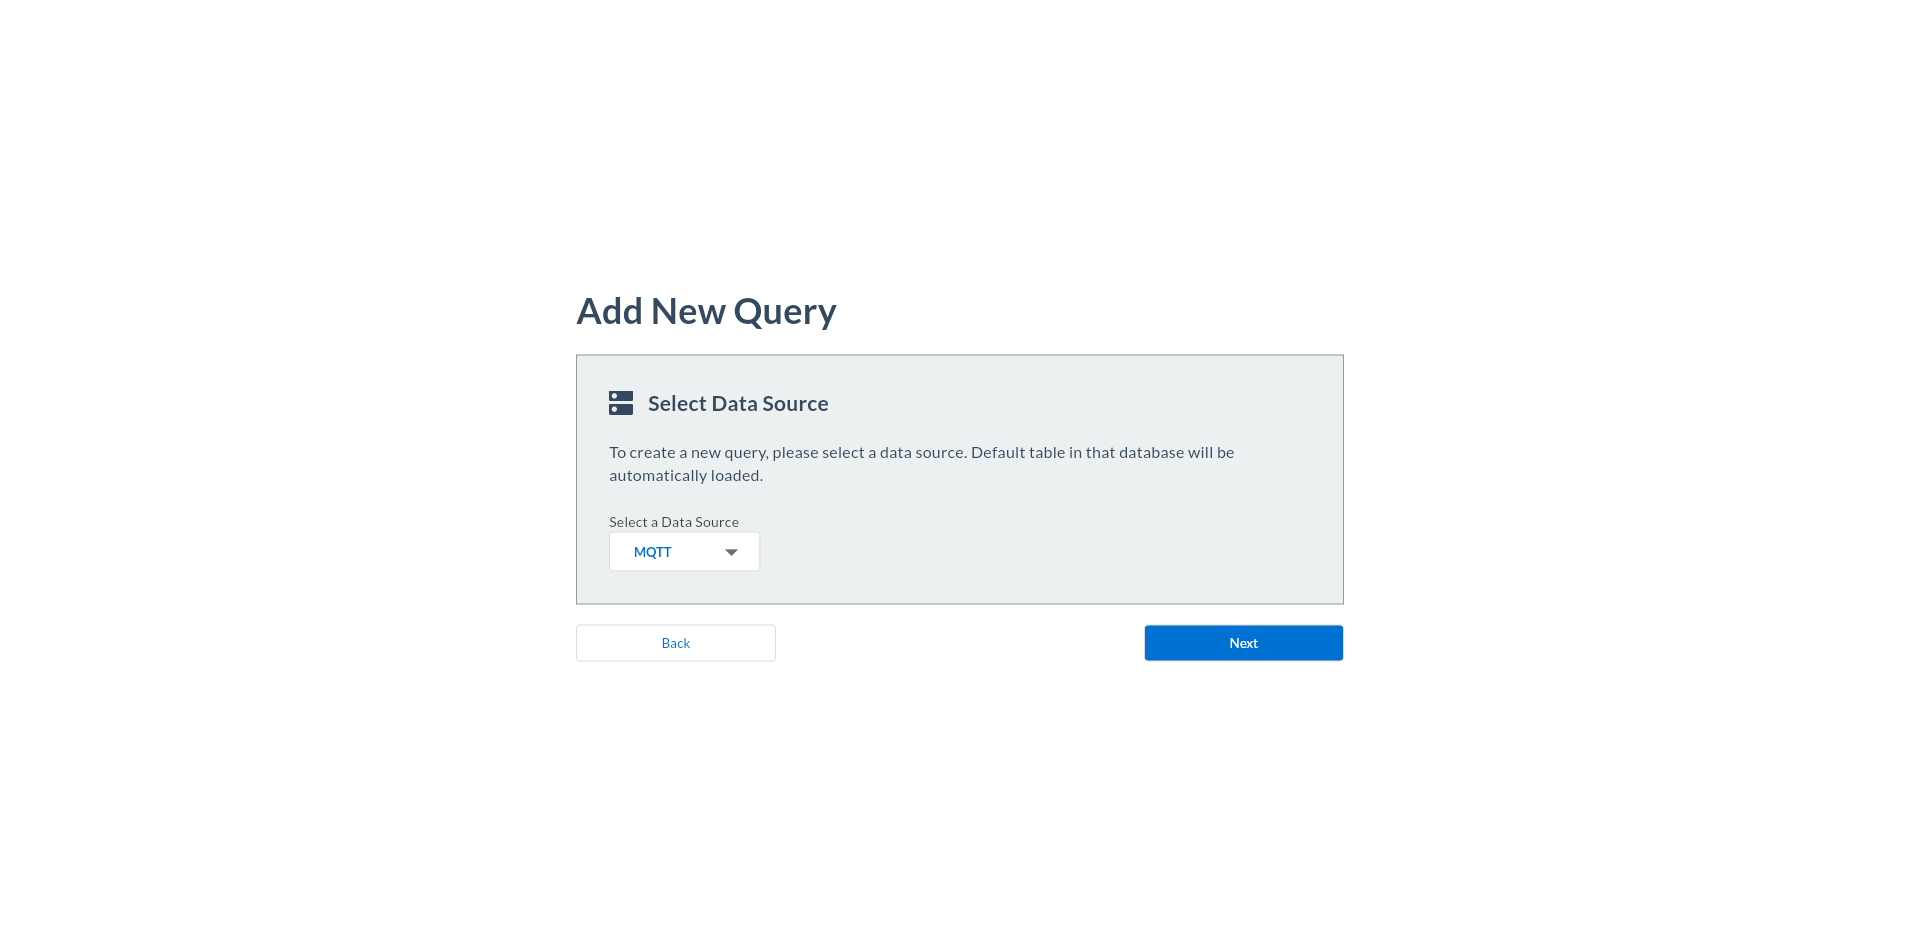
3. Select an MQTT Data Source
In the Select Your Data Source screen, choose the data source under the MQTT category.
Click Next.
4. The MQTT Topic Screen Opens
After selecting the MQTT data source, the topic browser screen opens.
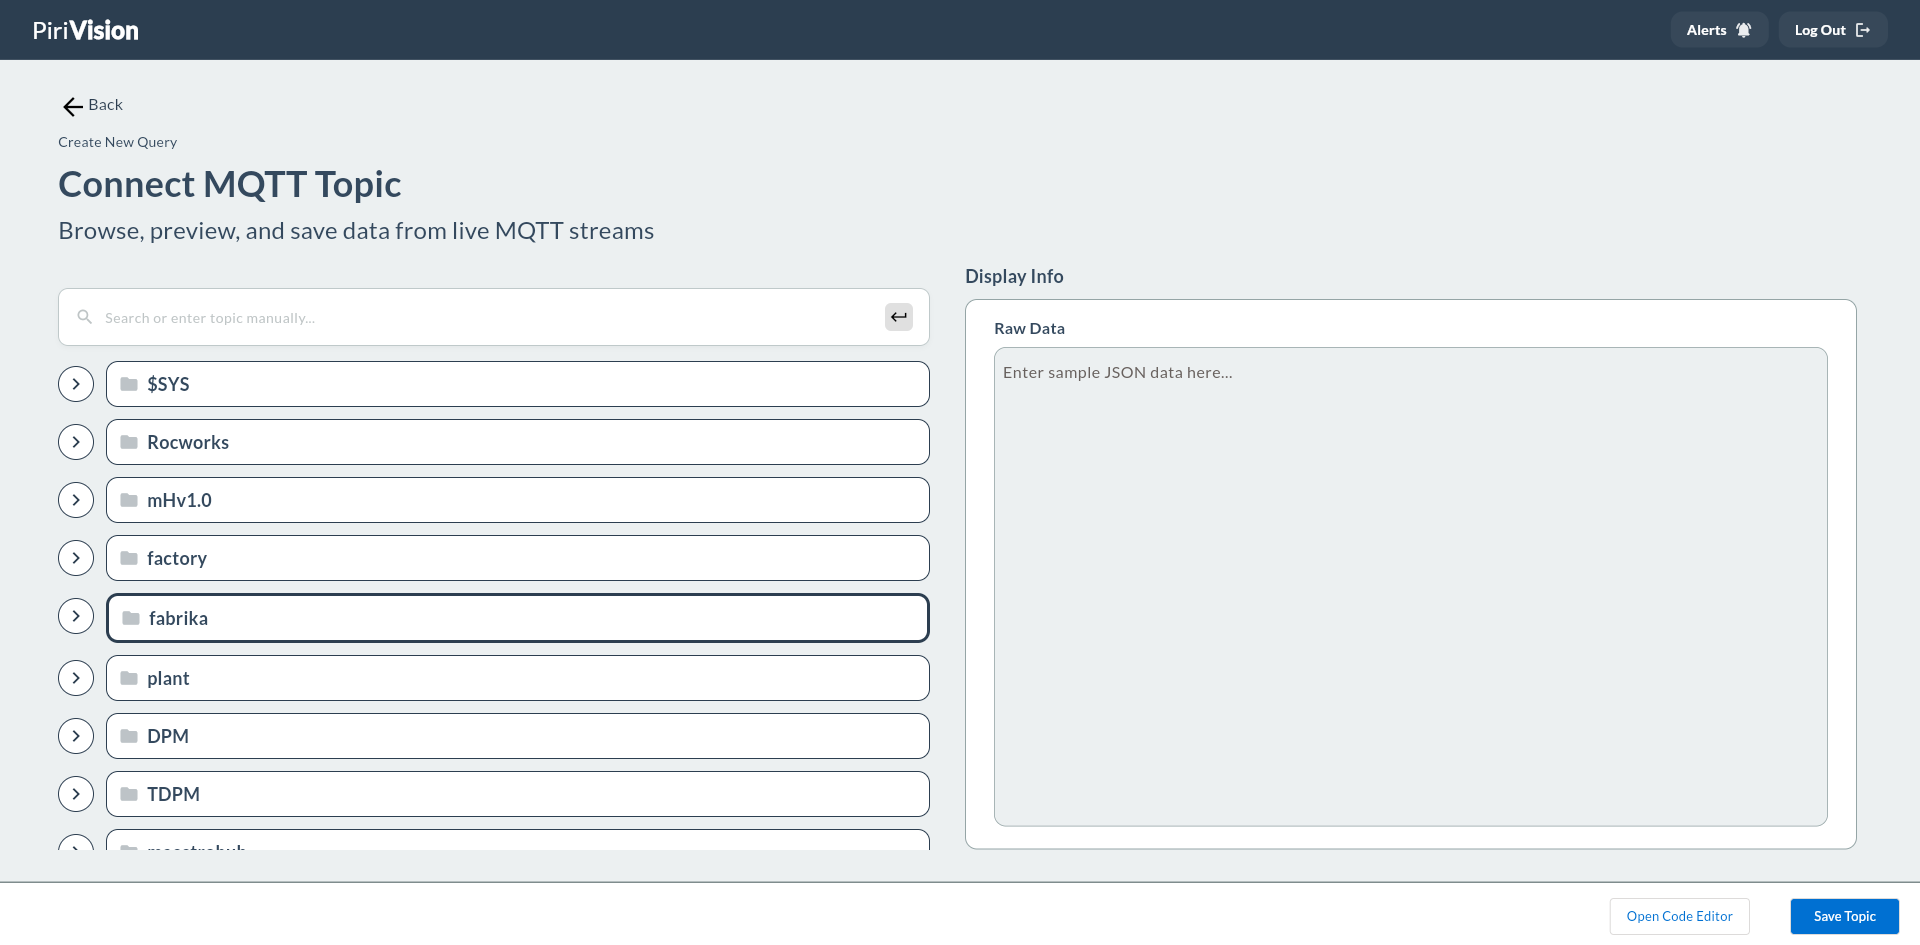
Screen layout:
| Section | Description |
|---|---|
| Connection Status | WebSocket connection status to the broker (Connected / Connecting / Error) |
| Topic Tree | All topics on the broker listed hierarchically |
| Search | Filter by topic name |
| Payload Preview | The most recent message received by the selected topic |
5. Verify the Broker Connection
When the screen opens, the system automatically connects to the MQTT broker configured in Port.
Check connection status:
- ✅ Connected: Topic tree loads and live messages appear.
- ⚠️ Connecting: Wait a few seconds.
- ❌ Connection Error: Check MQTT connection settings in the Port module.
6. Find and Select the Topic
Locate the topic you want to monitor in the topic tree. With the Demo Factory flow the tree looks like this:
- Click folder (prefix) names to expand / collapse them (
fabrika→hat1). - You can filter by typing the topic name in the search box.
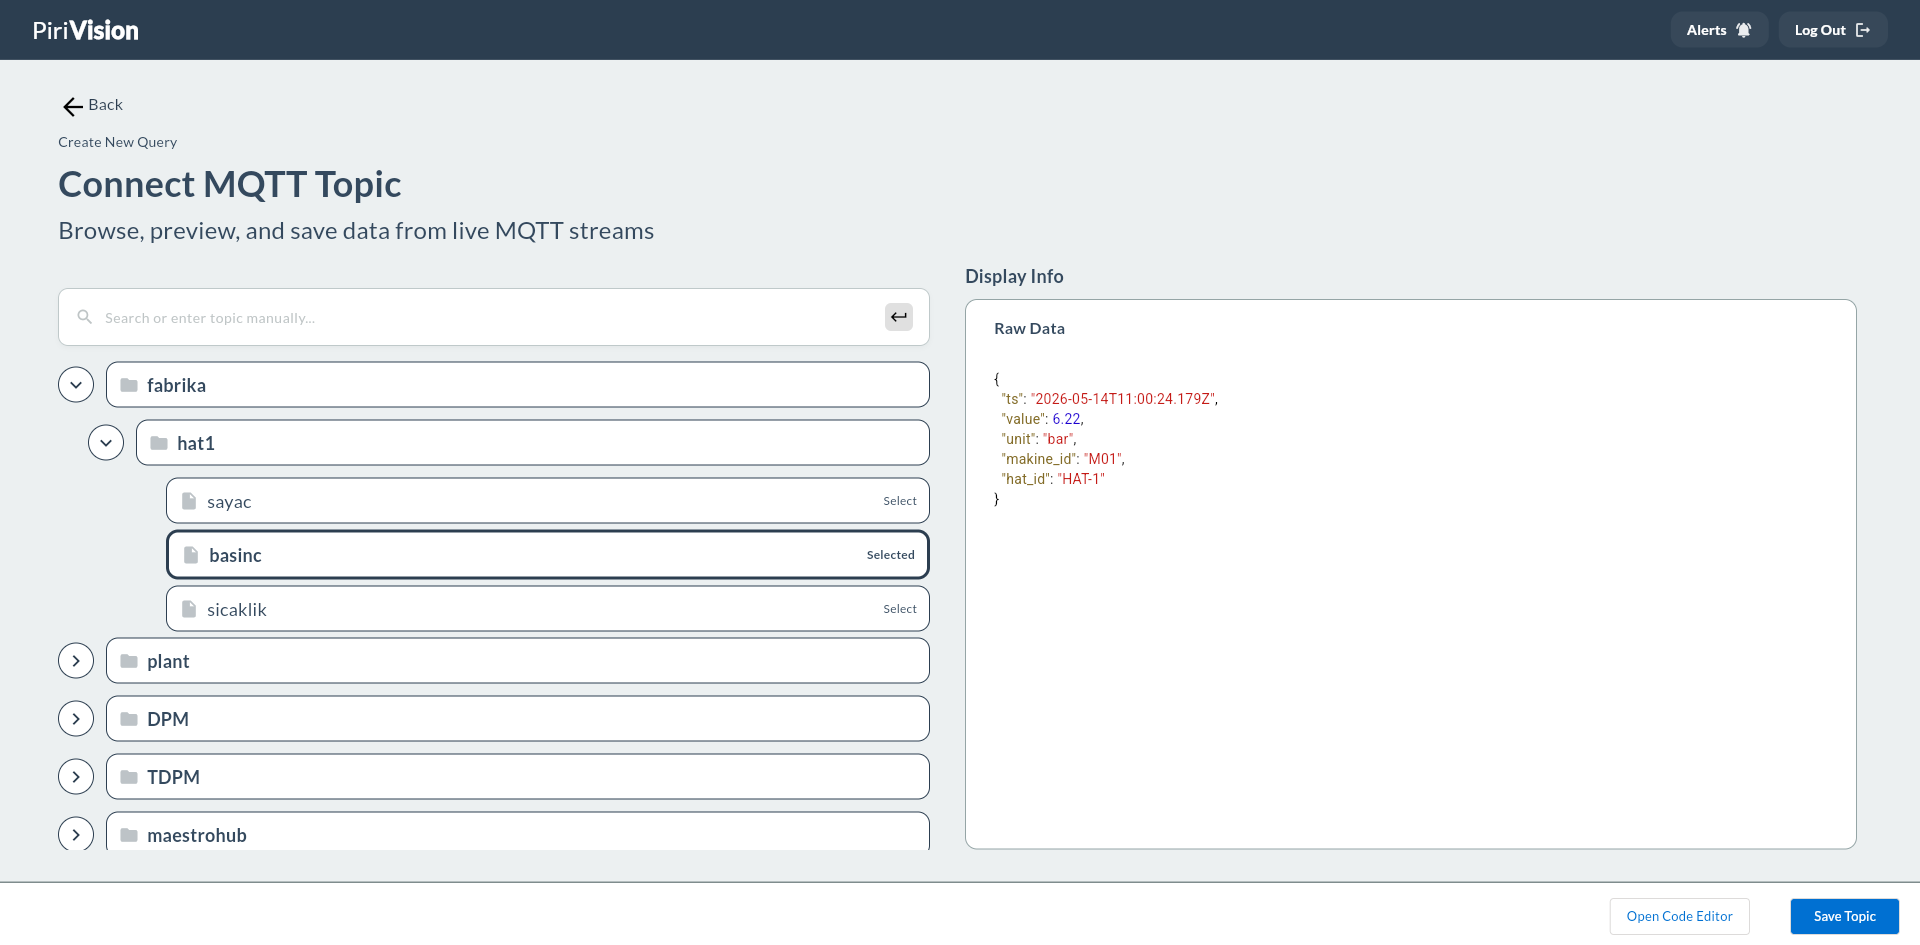
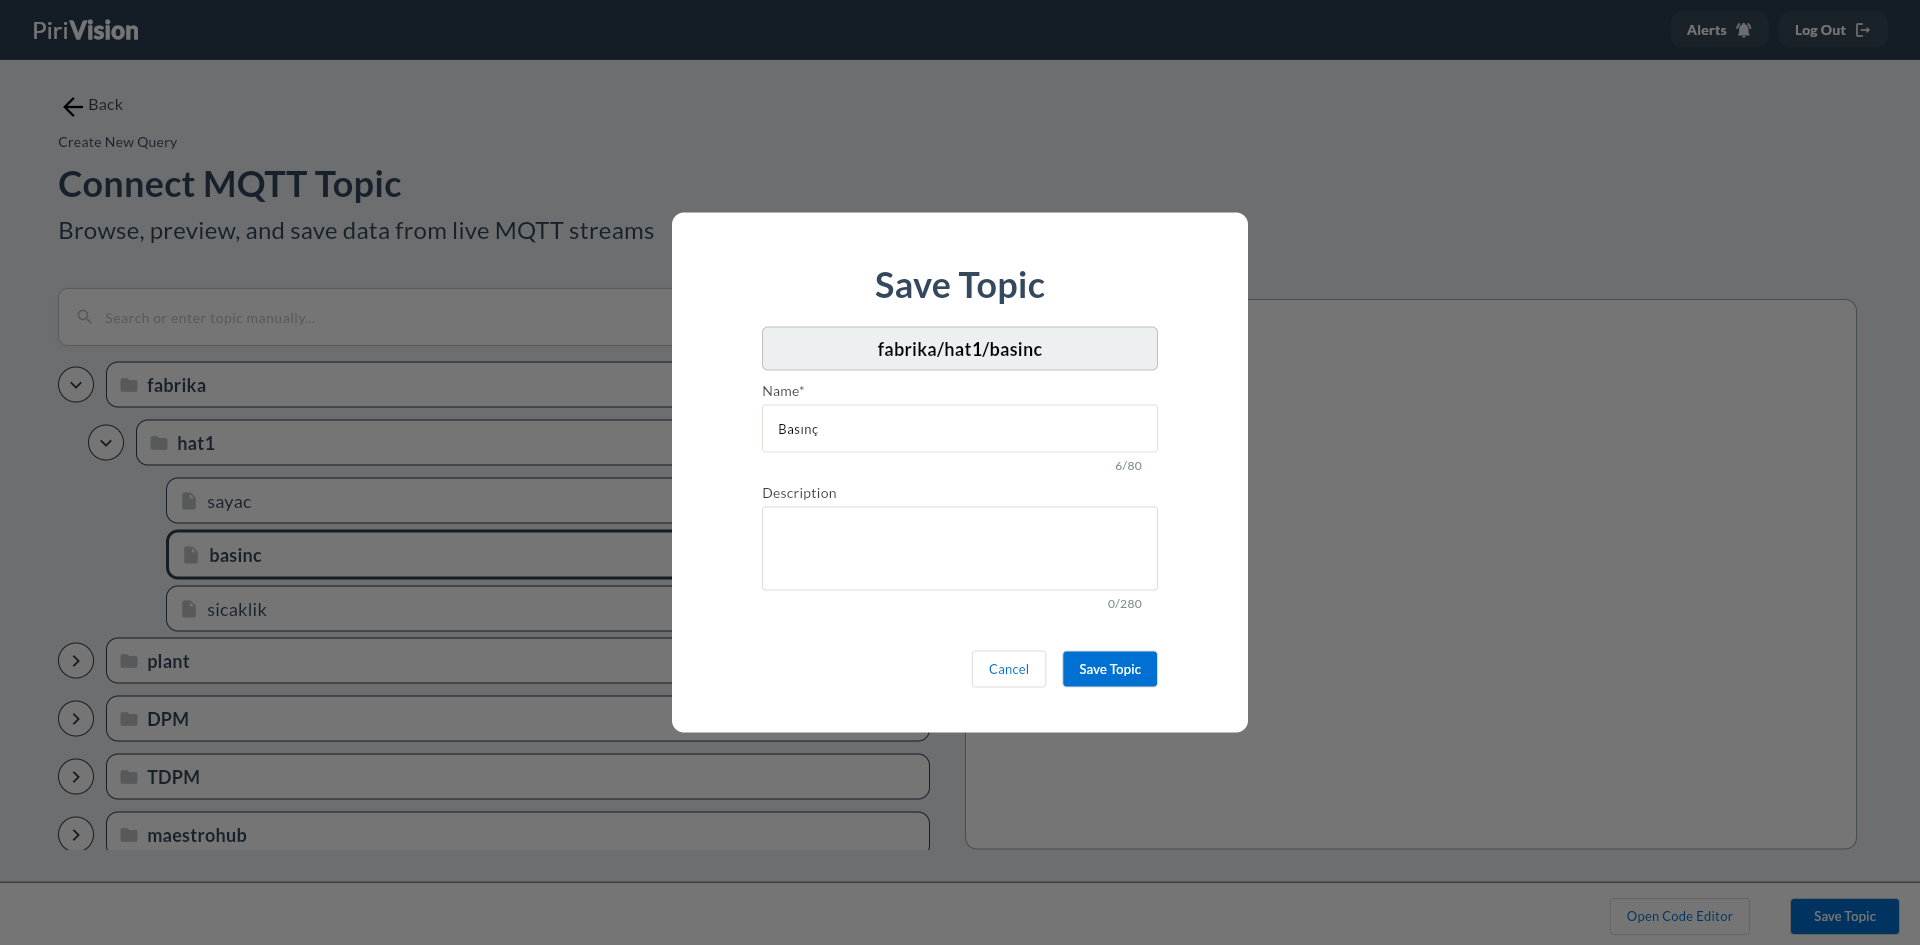
When you click the target topic (fabrika/hat1/sicaklik):
1. The topic is selected (highlighted).
2. The latest message of this topic appears as a Payload Preview on the right panel. The Demo Factory temperature payload looks like this (every 2 seconds):
{
  "ts": "2026-05-06T11:42:18.123Z",
  "value": 72.41,
  "unit": "°C",
  "makine_id": "M01",
  "hat_id": "HAT-1"
}
7. Save the Topic Record
After selecting the topic, click Save at the top right.
The save panel opens.
8. Display Info — Name and Description
| Field | Required | Description | Default | Example |
|---|---|---|---|---|
| Name | Yes | Record name shown in the Compass list | — | Line 1 Instant Temperature |
| Description | No | Text explaining the purpose of the record | — | Live sensor data from fabrika/hat1/sicaklik |
9. Location — Target Folder
Select the folder to save the record in via the Target Folder field.
If no folder is chosen, the record is added to the root directory.
10. Click the Save Button
Click the Save button at the bottom of the panel.
When the topic record is saved successfully, you are redirected to the Compass list.
11. Verify in the List
A new MQTT topic card should appear in the Compass list.
12. Common Errors
| Error / Symptom | Possible Cause | Solution |
|---|---|---|
| Cannot connect to broker | Wrong host, port, or protocol | Check MQTT data source settings in the Port module |
| Topic tree is empty | No active topic published on the broker | Verify your sensors are sending messages; for the Demo Factory stream see Synthetic Data Generation — MQTT |
fabrika/... topics not visible |
Node-RED flow not started | See Synthetic Data Generation — MQTT |
| No data in payload preview | Topic is inactive or message frequency is very low | Verify MQTT publishing via the device's own interface |
"you already have a query named '...'" |
Another Compass record with the same name exists | Choose a different name |
Next Step
After the MQTT topic is saved to Compass, you can create a real-time widget in Cartography.