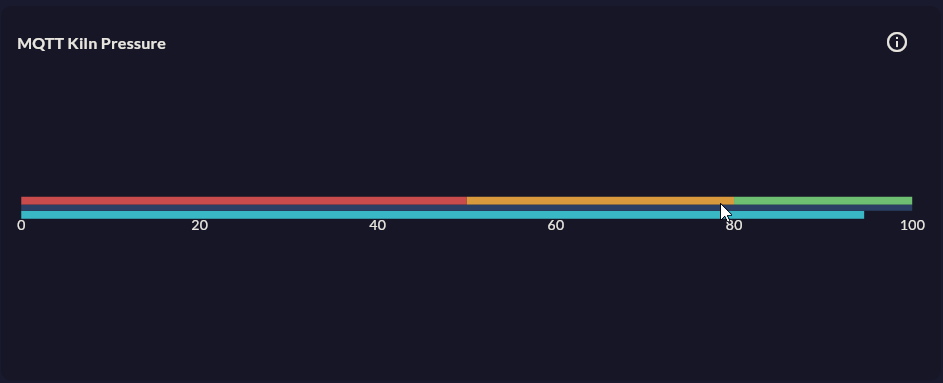
Linear Gauge
Linear Gauge shows a single instant value on a horizontal or vertical bar. Ideal for tank fill level, progress to a production target, and set-point comparisons.
Prerequisite
This chart type can only be selected in step 2 of the Cartography Widget Wizard. If you have not started widget creation, start the wizard first; an appropriate Compass record is also required.
When to Use
| Scenario | Orientation Preference |
|---|---|
| Raw material silo fill level | Vertical (silo view) |
| Daily production target progress | Horizontal (progress bar) |
| Belt speed distance to set point | Horizontal |
| Water tank level | Vertical |
Data Structure
Same as Radial Gauge — single numeric value:
| Column | Type | Example |
|---|---|---|
| Value column | NUMERIC |
fill_percent, speed_mps |
-- Example: silo fill
SELECT fill_ton / capacity_ton * 100 AS fill_percent
FROM silo_status
WHERE silo_id = 'SILO_01'
ORDER BY ts DESC
LIMIT 1;
Wizard Configuration
Linear Gauge routes in Step 4 to a special Linear Gauge Axis Design screen.
Axis Design — Main Fields
| Section | Field | Description |
|---|---|---|
| Orientation | Direction | Horizontal / Vertical |
| Axis Range | Min / Max | Scale limits |
| Axis Range | Tick Interval | Section interval |
| Bar Pointer | Color | Filled portion color |
| Bar Pointer | Thickness | Bar thickness (px) |
| Bar Pointer | Corner Radius | Bar end roundness |
| Marker Pointer | Show / Hide | Arrow marking the current value |
| Marker Pointer | Color / Size | Marker style |
| Range Bands | Band Limits | Color zone ranges |
| Value Source | Value Column | Record column |
Vertical Tank Display
For silo or tank visualization: Orientation = Vertical, Bar Pointer color = light blue / green, Max = capacity tonnage, Min = 0. A grey/dark card background makes the tank look more realistic.
Skipped Steps
When Axis Design is complete, steps 5, 6, 7 are skipped; you go directly to Step 8 Card Design.
9-Step Summary — For Linear Gauge
Linear Gauge uses the Linear flow. Steps 5, 6, 7 are skipped.
| # | Step | Key point for Linear Gauge | Detail |
|---|---|---|---|
| 1 | Group Selection | Gauge | → |
| 2 | Chart Type | Linear Gauge card | → |
| 3 | Compass Record | Single row, single numeric value (LIMIT 1) |
→ |
| 4 | Linear Gauge Axis Design | Orientation (Horizontal/Vertical), Axis Range, Bar Pointer, Marker Pointer (Triangle/Arrow/Line), Range Bands, Value Source | → |
| 5-7 | (skipped) | — | — |
| 8 | Card Design | Refresh: 0 (MQTT), 5-15s (SQL) | → |
| 9 | Display | Name, Tags, Folder | → |