Step Line Series
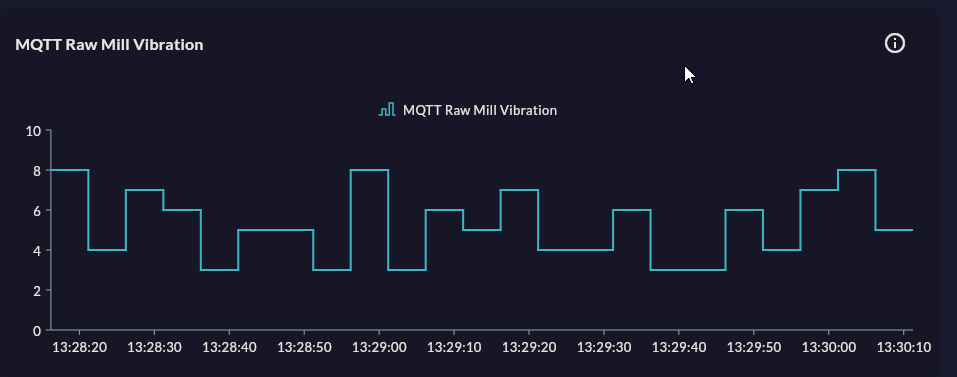
Step Line Series draws right-angled steps between data points instead of straight lines. Used in scenarios where a value changes instantly (set point update, alarm state, valve open/closed).
Prerequisite
This chart type can only be selected in step 2 of the Cartography Widget Wizard. If you have not started widget creation, start the wizard first; an appropriate Compass record is also required.
When to Use
| Scenario | Why Step Line? |
|---|---|
| Set point history | Value changes suddenly, interpolation in between is wrong |
| Alarm state (0/1) | Binary signal — "on" or "off" |
| Recipe step tracking | Constant value at each step |
| PLC output signal | Digital pulse — not continuous, step-based |
When Step Line is wrong
Do not use Step Line for continuously changing physical quantities like temperature or pressure. While the actual change is linear, a stepped appearance gives a misleading impression.
Data Structure
| Column | Type | Example |
|---|---|---|
| X column | TIMESTAMP / TEXT |
ts, event_time |
| Y column | NUMERIC |
setpoint_value, alarm_state |
-- Example: last 1 hour of set point change history
SELECT ts, setpoint_temperature
FROM setpoint_log
WHERE ts >= NOW() - INTERVAL '1 hour'
ORDER BY ts;
Wizard Configuration
Step 4 — Axis Config
For Step Line, X Axis Type is usually DateTimeAxis. Step transition timing is important.
Step 5 — Series Design
Same fields as Line (color, stroke width, marker, animation). Step direction (pre/post step) can be selected from the general design or series design fields.
Tips
- For an alarm signal (0/1), set Y axis min 0, max 1.2; the area looks more readable.
- To show multiple digital signals, assign a different color per series and show the unit on the Y axis label.
9-Step Summary — Step Line Series
Step Line Series uses the Standard Cartesian flow. Renders a stepped line for set points and digital signals.
| # | Step | Key point for Step Line | Details |
|---|---|---|---|
| 1 | Group Selection | Cartesian | → |
| 2 | Chart Type | Step Line Series card | → |
| 3 | Compass Record | Set point / signal change points | → |
| 4 | Axis Config | X: DateTime/Category, Y: Numeric | → |
| 5 | Series Design | Step Type (pre/post), Stroke Width | → |
| 6 | Add Series | Multiple digital signals | → |
| 7 | General Design | Y axis Min/Max lock (e.g. 0-1.2 for alarm) | → |
| 8 | Card Design | Refresh: 5-30s (for live changes) | → |
| 9 | Display | Name, Tags, Folder | → |
→ Standard Cartesian Flow overview