4. Radial Gauge Axis Design
This step is the dedicated screen containing all visual configuration for the Radial Gauge: the gauge's numeric range, angle configuration, colored zones (range bands), pointer type, and value source.
Unlike standard Cartesian, you do not see a Y-axis dropdown; instead the radialgaugeaxisdesign screen opens.
Wizard route: /cartography/add/radialgaugeaxisdesign
Prerequisite
A Compass record must be selected in Step 3 and the query result loaded.
This Screen Contains All Visual Settings
Steps 5/6/7 are skipped for Radial Gauge. Axis Range, colored bands, pointer, label, and value source are all configured here.
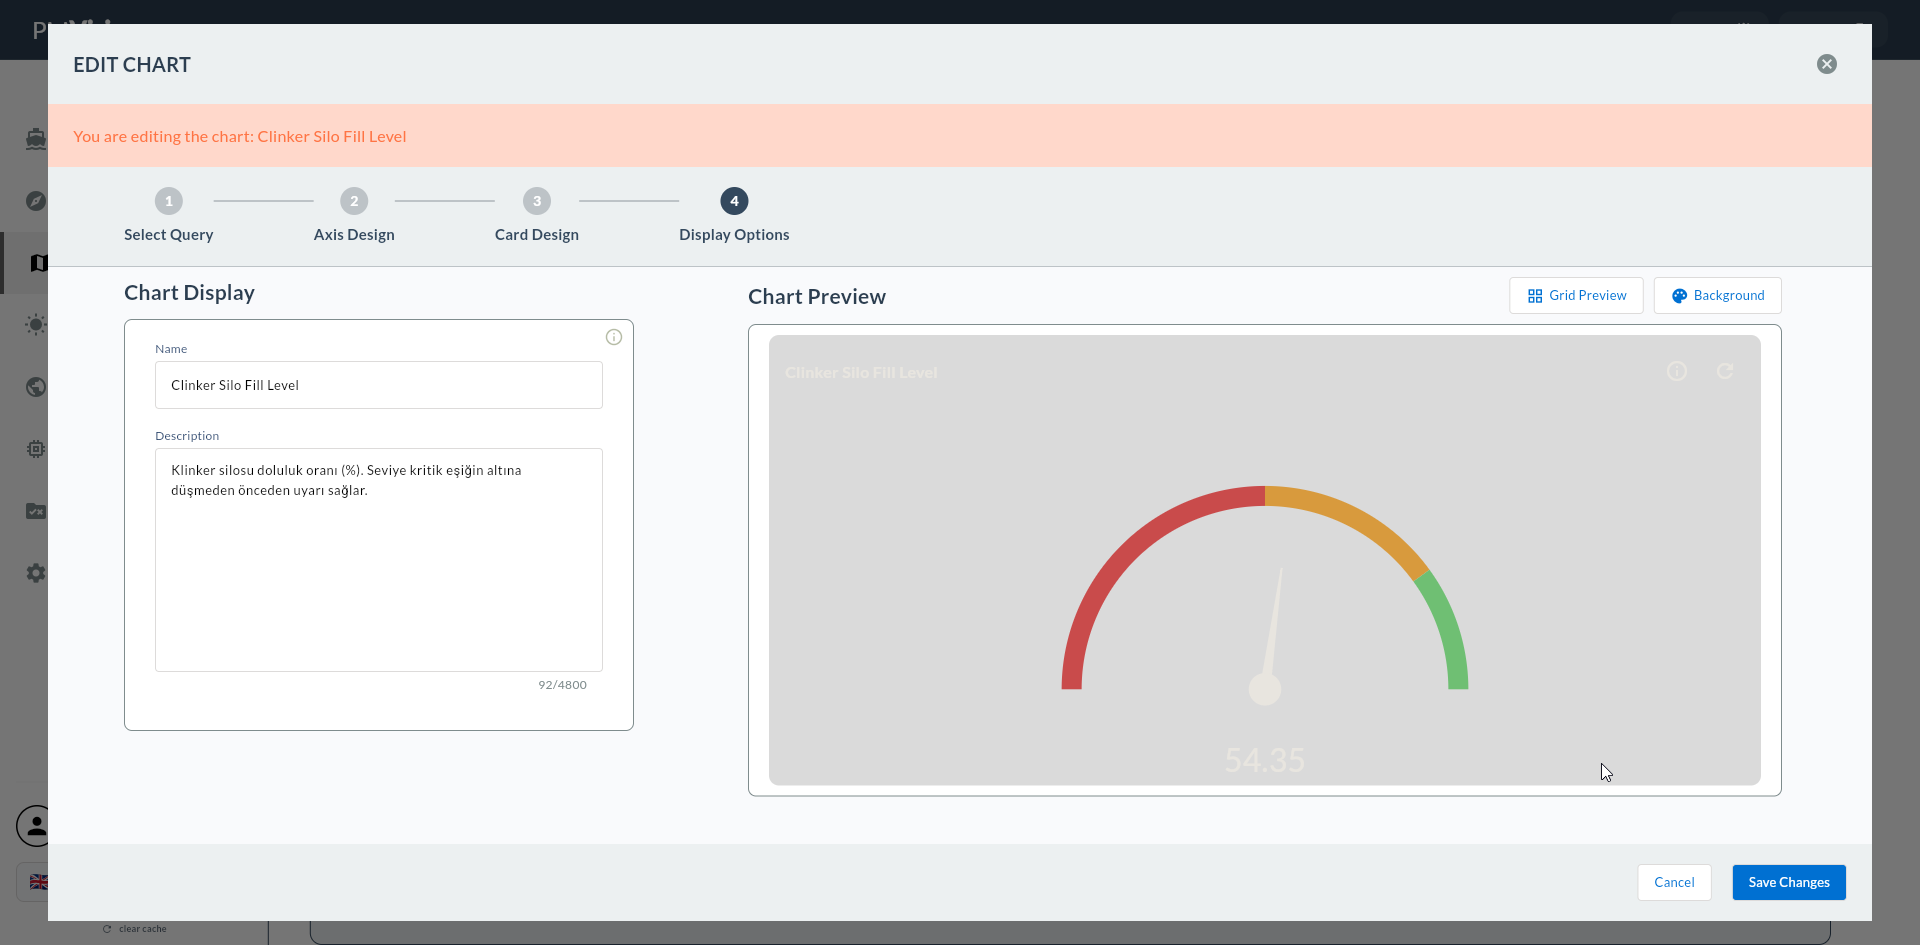
1. Screen Layout
The left side contains the configuration form; the right side shows a live gauge preview.
2. Axis Range
The gauge's numeric range and angle configuration.
| Field | Description | Example |
|---|---|---|
| Min Value | The zero point of the gauge | 0 |
| Max Value | The full-scale point of the gauge | 100 (OEE), 1200 (temperature) |
| Tick Interval | Scale mark spacing | 10, 20 |
| Start Angle | Starting angle of the pointer arc (°) | 135 |
| End Angle | Ending angle of the pointer arc (°) | 405 |
Angle Recommendation for OEE Gauge
Start = 135°, End = 405° — slightly more than a semicircle, leaving room for a label at the bottom center.
Exceeding Max
If the value can exceed Max, set Max to 120 or 150 so the pointer does not go off-scale. For example, if current sometimes reaches 110 A but Max is 100, the gauge will "break".
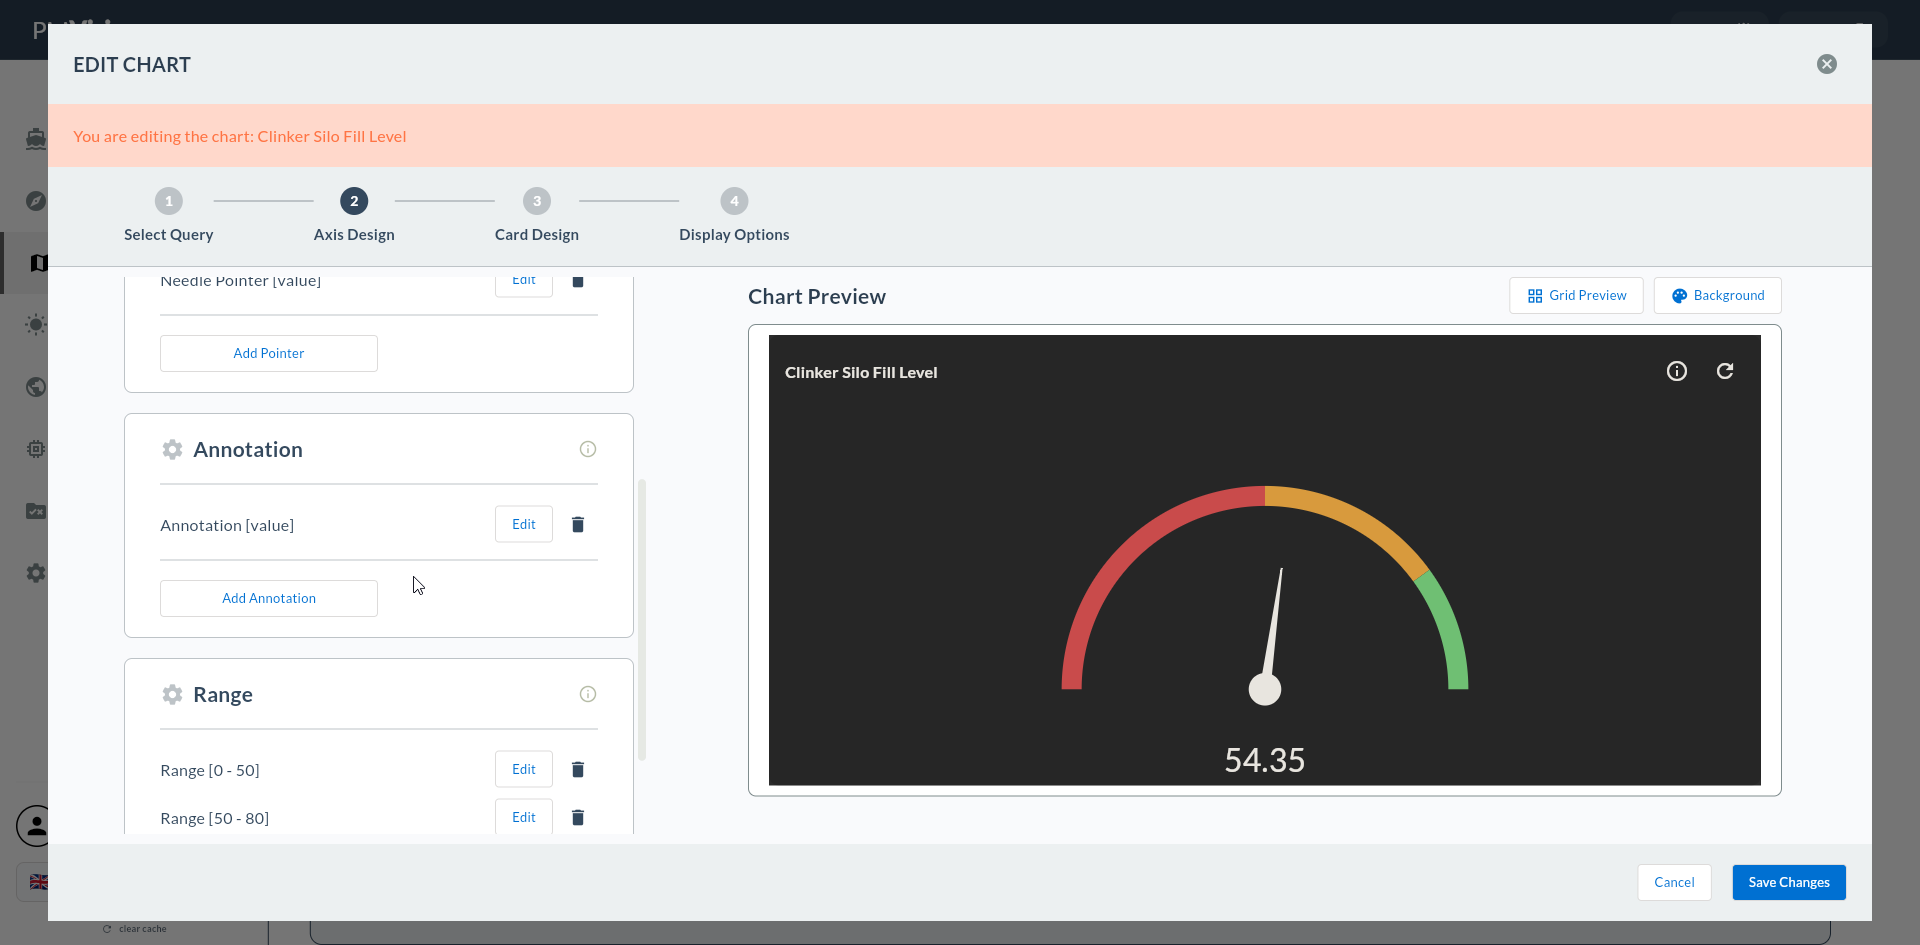
3. Range Bands (Colored Zones)
Colored bands on the gauge arc allow operators to read status at a glance.
| Field | Description |
|---|---|
| Band Min | Band lower bound |
| Band Max | Band upper bound |
| Band Color | Band color |
Multiple bands can be added. Typical 3-band configuration:
| Band | Min - Max | Color |
|---|---|---|
| Poor | 0 - 60 | 🔴 Red |
| Medium | 60 - 85 | 🟡 Yellow |
| Good | 85 - 100 | 🟢 Green |
Thresholds Per Facility Standard
OEE bands vary by industry and facility standard. Use the same thresholds given to operators; otherwise the gauge is misleading.
4. Pointer
| Field | Description | Possible Values |
|---|---|---|
| Pointer Type | Pointer style | Needle (classic pointer) / Range (fan) |
| Pointer Color | Pointer color | color |
| Pointer Width | Pointer thickness (for Needle) | px |

Choosing Pointer Type
- Needle: Classic gauge appearance; analog tachometer / OEE.
- Range: Instead of a needle, a fan fills up to the value; looks like a progress percentage.
5. Annotations (Center Value Label)
The numeric display of the value in the center of the gauge.
| Field | Description | Example |
|---|---|---|
| Format | Value format string | {0}%, {0} °C, {0} bar |
| Font Size | Label font size | px |
| Color | Label color | color |
| Position | Label position within the gauge | center / bottom |
Format String
{0} is replaced with the actual value. For example, writing {0}% displays the value 92.5 as 92.5%.
6. Value Source
| Field | Description |
|---|---|
| Value Column | The numeric column from the Compass record that feeds the gauge |
If Value Source Is Left Empty
If this field is not filled, the Next button gives a warning: "Please select a value source column".
7. Confirmation
When you click the Next button at the top right, flow.hasAxisDesign = true is marked and you go directly to Step 8 Card Design (5, 6, 7 are skipped).
8. Next Step
5, 6, 7 Are Skipped
Because all visual settings for Radial Gauge are configured in this step, Series Design, Add Series, and General Design are skipped.