Table (DataGrid)
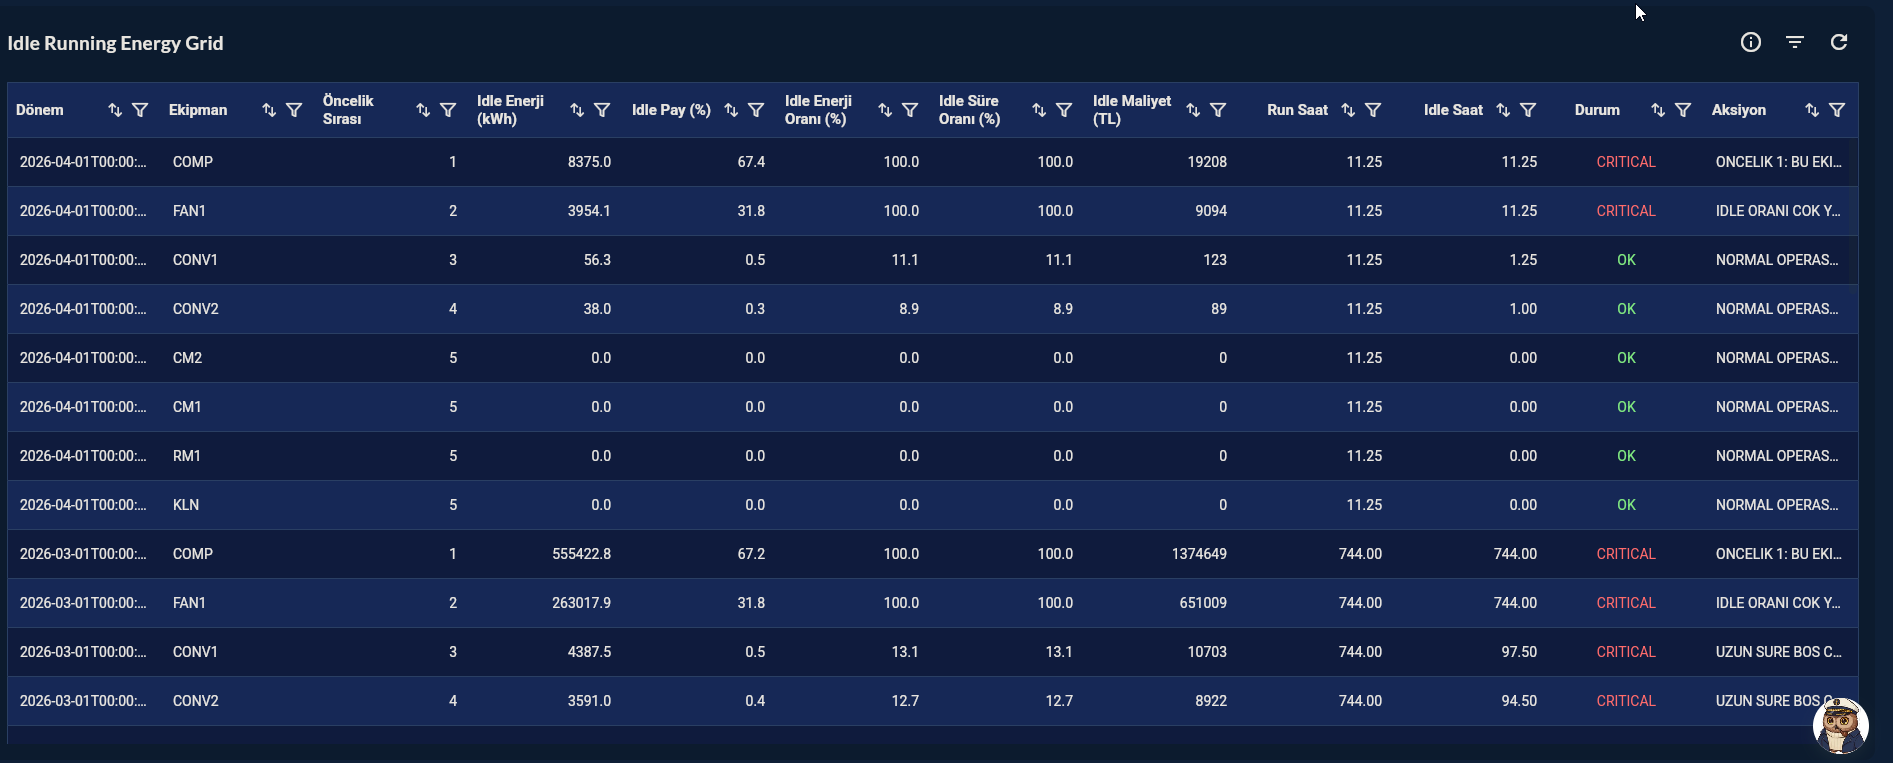
Table (DataGrid) shows all columns returned from the Compass record in table format. Column visibility, sorting, filtering, and row style can be customized. Used for reporting, process log monitoring, and parameter listing.
Prerequisite
This chart type can only be selected in step 2 of the Cartography Widget Wizard. If you have not started widget creation, start the wizard first; an appropriate Compass record is also required.
When to Use
| Scenario | Example Columns |
|---|---|
| Active alarm list | Time, Machine, Alarm Description, Level |
| Product recipe parameters | Parameter, Unit, Nominal, Tolerance |
| Shift production log | Date, Line, Product, Count, OEE |
| Last 50 sensor readings | Timestamp, Device, Value, Unit |
| Maintenance history | Date, Machine, Work Order, Technician |
Data Structure
The query may return any column structure. All columns are added to the table automatically.
-- Example: last 50 alarms
SELECT ts, machine_name, alarm_code, description, priority
FROM alarm_log
ORDER BY ts DESC
LIMIT 50;
Wizard Flow
Skipped Steps
In the DataGrid flow, Step 4 Data Configuration, Step 5 Series Design, Step 6 Add Series are skipped. After the record is selected, you go directly to Step 7 General Design.
Group → Chart Type → Record → General Design (column config) → Card Design → Display
Step 7 — General Design (DataGrid-specific)
| Field | Description |
|---|---|
| Column Visibility | Show / hide each column |
| Column Order | Reorder by drag-and-drop |
| Column Width | Fixed pixel or flexible width |
| Header Style | Font size, color, background |
| Row Height | Row pixel height |
| Grid Lines | Horizontal / vertical line visibility |
| Pagination | Rows per page |
| Sortable | Sort by clicking header |
| Filterable | Per-column search box |
| Row Color Rule | Conditional row color (e.g. priority = high → red) |
Tips
- Add
LIMITto the query; unlimited rows reduce widget performance (recommended: ≤ 500 rows). - Return date/time columns as formatted text with
TO_CHAR(ts, 'DD.MM.YYYY HH24:MI')— more readable in table cells. - For conditional row color, add a separate
color_codecolumn and bind it to DataGrid rules.
9-Step Summary — For Table (DataGrid)
Table uses the DataGrid flow. Steps 4, 5, 6 are skipped — all visual/functional settings are in Step 7.
| # | Step | Key point for Table | Detail |
|---|---|---|---|
| 1 | Group Selection | DataGrid | → |
| 2 | Chart Type | Table card | → |
| 3 | Compass Record | Multi-column query, LIMIT ≤ 500 |
→ |
| 4-6 | (skipped) | — | — |
| 7 | General Design | Header/Row/Cell style, Grid Lines, Column Visibility/Order/Width, Pagination, Sort, Filter, Conditional Row Color | → |
| 8 | Card Design | Refresh: 15-60s (alarm), 300-600s (historical) | → |
| 9 | Display | Name, Tags, Folder | → |
Next Step
→ Back to DataGrid Group → Two-Column List — For two-column summary lists