Radial Gauge
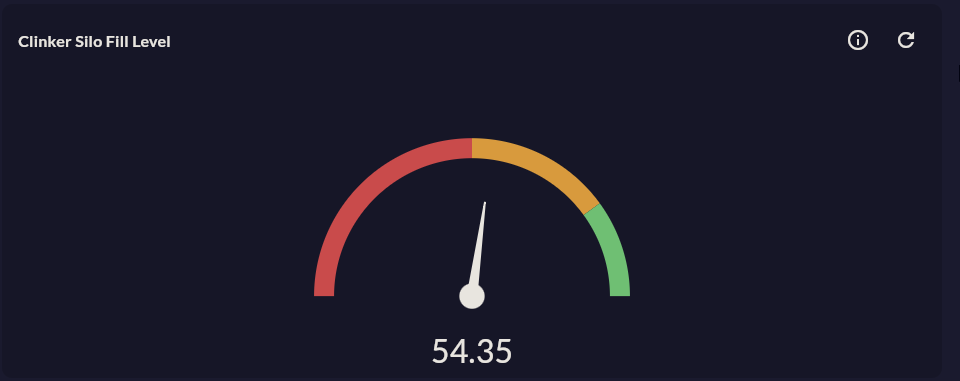
Radial Gauge shows a single instant numeric value with a needle on a circular gauge. Used to visualize the instant state of critical KPIs such as OEE, temperature, speed, and pressure.
Prerequisite
This chart type can only be selected in step 2 of the Cartography Widget Wizard. If you have not started widget creation, start the wizard first; an appropriate Compass record is also required.
When to Use
| Scenario | Value Range |
|---|---|
| OEE score | 0 – 100 % |
| Kiln temperature | 0 – 1200 °C |
| Compressor pressure | 0 – 10 bar |
| Motor speed | 0 – 3000 RPM |
| Tank fill level | 0 – 100 % |
Data Structure
The Compass record must return a single row, single numeric value:
| Column | Type | Example |
|---|---|---|
| Value column | NUMERIC |
oee_percent, temperature |
Wizard Configuration
Radial Gauge routes in Step 4 to a special Radial Gauge Axis Design screen instead of the standard Axis Config.
Axis Design — Main Fields
| Section | Field | Description |
|---|---|---|
| Axis Range | Min Value | Zero point of the gauge |
| Axis Range | Max Value | Full point of the gauge |
| Axis Range | Tick Interval | Scale tick spacing |
| Axis Range | Start Angle | Needle start angle (°) |
| Axis Range | End Angle | Needle end angle (°) |
| Range Bands | Band Min/Max | Color zone limits |
| Range Bands | Band Color | Red / Yellow / Green |
| Pointer | Pointer Type | Needle / Range (fan) |
| Pointer | Pointer Color | Needle color |
| Annotations | Format | Value format string ({0}%, {0} °C) |
| Value Source | Value Column | Numeric column from the record |
Typical Color Band Setup
For OEE: 0–60 Red, 60–85 Yellow, 85–100 Green. Set band limits according to your sector and plant standards.
Skipped Steps
When Axis Design is complete, Step 5 Series Design, Step 6 Add Series, Step 7 General Design are skipped; you go directly to Step 8 Card Design.
Refresh Interval in Card Design
Since Radial Gauge shows the instant value, a short refresh interval is recommended. Set the Refresh Interval field in Card Design (Step 8) to 5–30 seconds.
Tips
- If the value can exceed 100%, set Max Value to
120or150; the needle won't go off the scale. - To compare multiple machines, use Radial Bar; each machine becomes a separate ring.
9-Step Summary — For Radial Gauge
Radial Gauge uses the Radial flow. Steps 5, 6, 7 are skipped — all visual settings are in Step 4.
| # | Step | Key point for Radial Gauge | Detail |
|---|---|---|---|
| 1 | Group Selection | Gauge | → |
| 2 | Chart Type | Radial Gauge card | → |
| 3 | Compass Record | Single row, single numeric value (LIMIT 1) |
→ |
| 4 | Radial Gauge Axis Design | Min/Max, Angle, Range Bands, Pointer (Needle/Range), Annotations Format, Value Source | → |
| 5-7 | (skipped) | — | — |
| 8 | Card Design | Refresh: 0 (MQTT), 5-30s (SQL) | → |
| 9 | Display | Name, Tags, Folder | → |
Next Step
→ Linear Gauge → Radial Bar — For multi-category → Back to Gauge Group