4. Linear Gauge Axis Design
This step is the dedicated screen containing all visual configuration for the Linear Gauge: orientation (horizontal/vertical), numeric range, bar pointer (background bar), marker pointer (indicator marking the current value), colored zones, and value source.
Wizard route: /cartography/add/lineargaugeaxisdesign
Prerequisite
A Compass record must be selected in Step 3 and the query result loaded.
This Screen Contains All Visual Settings
Steps 5/6/7 are skipped for Linear Gauge. All visual settings are configured in this step.
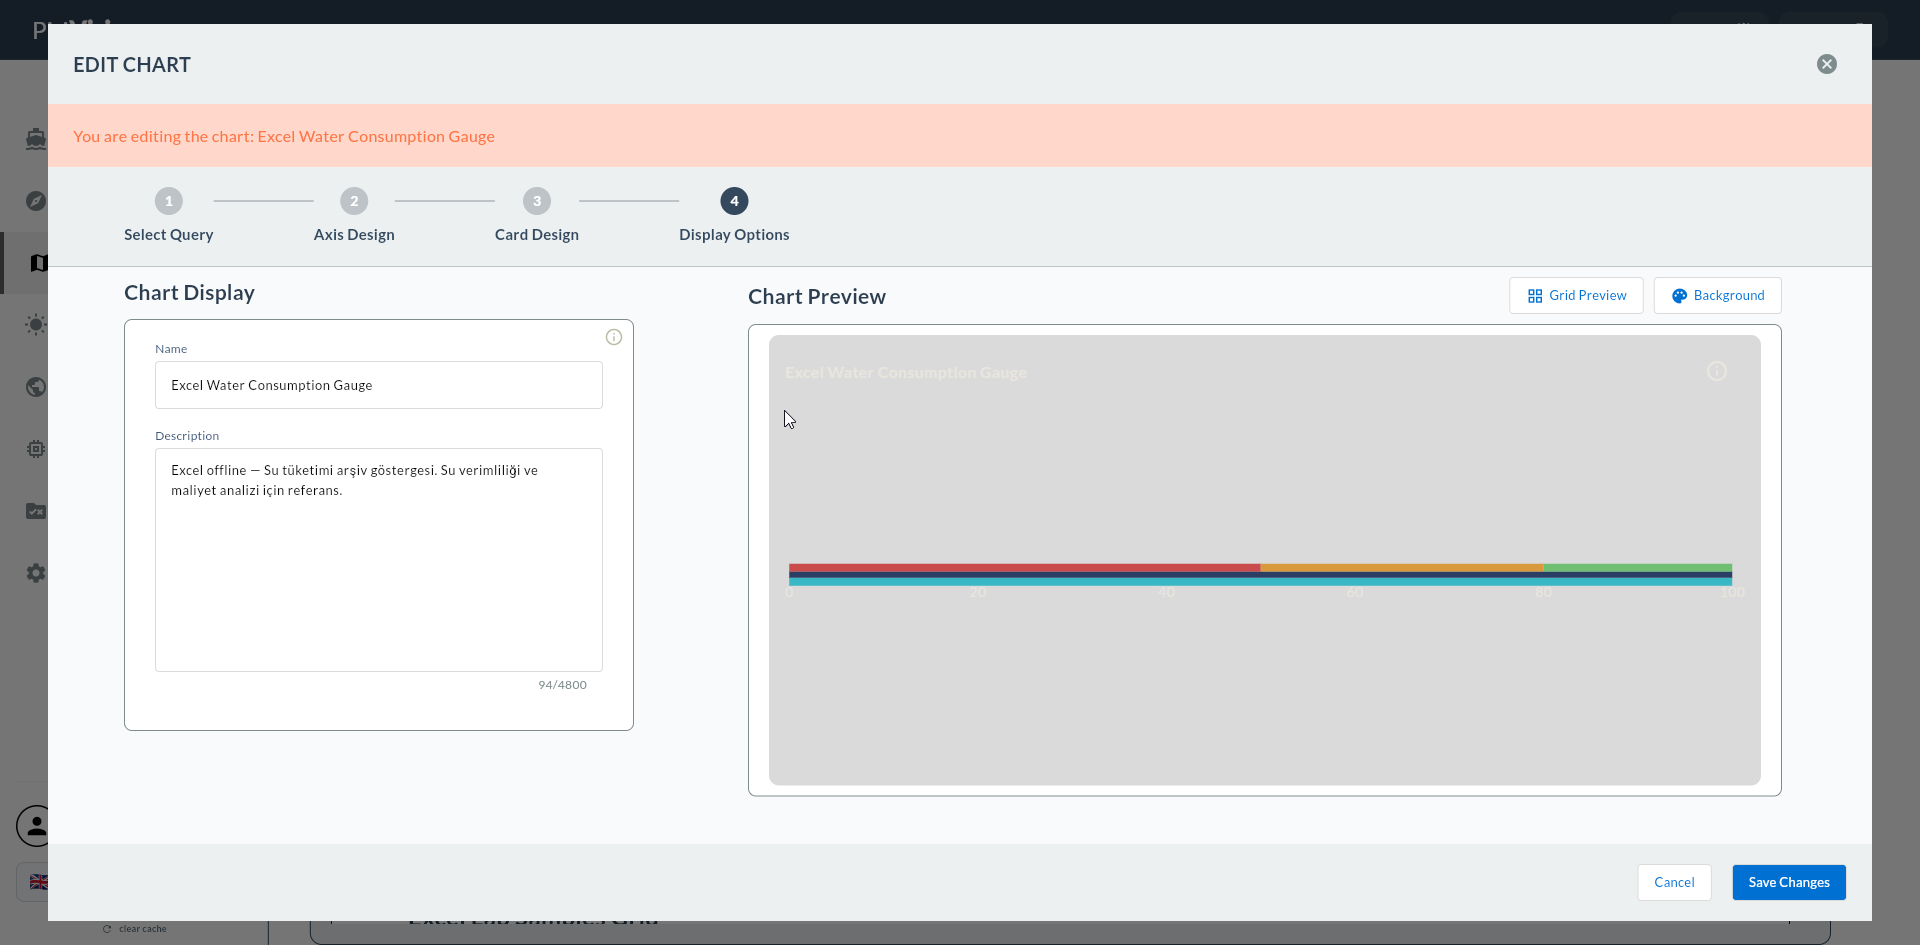
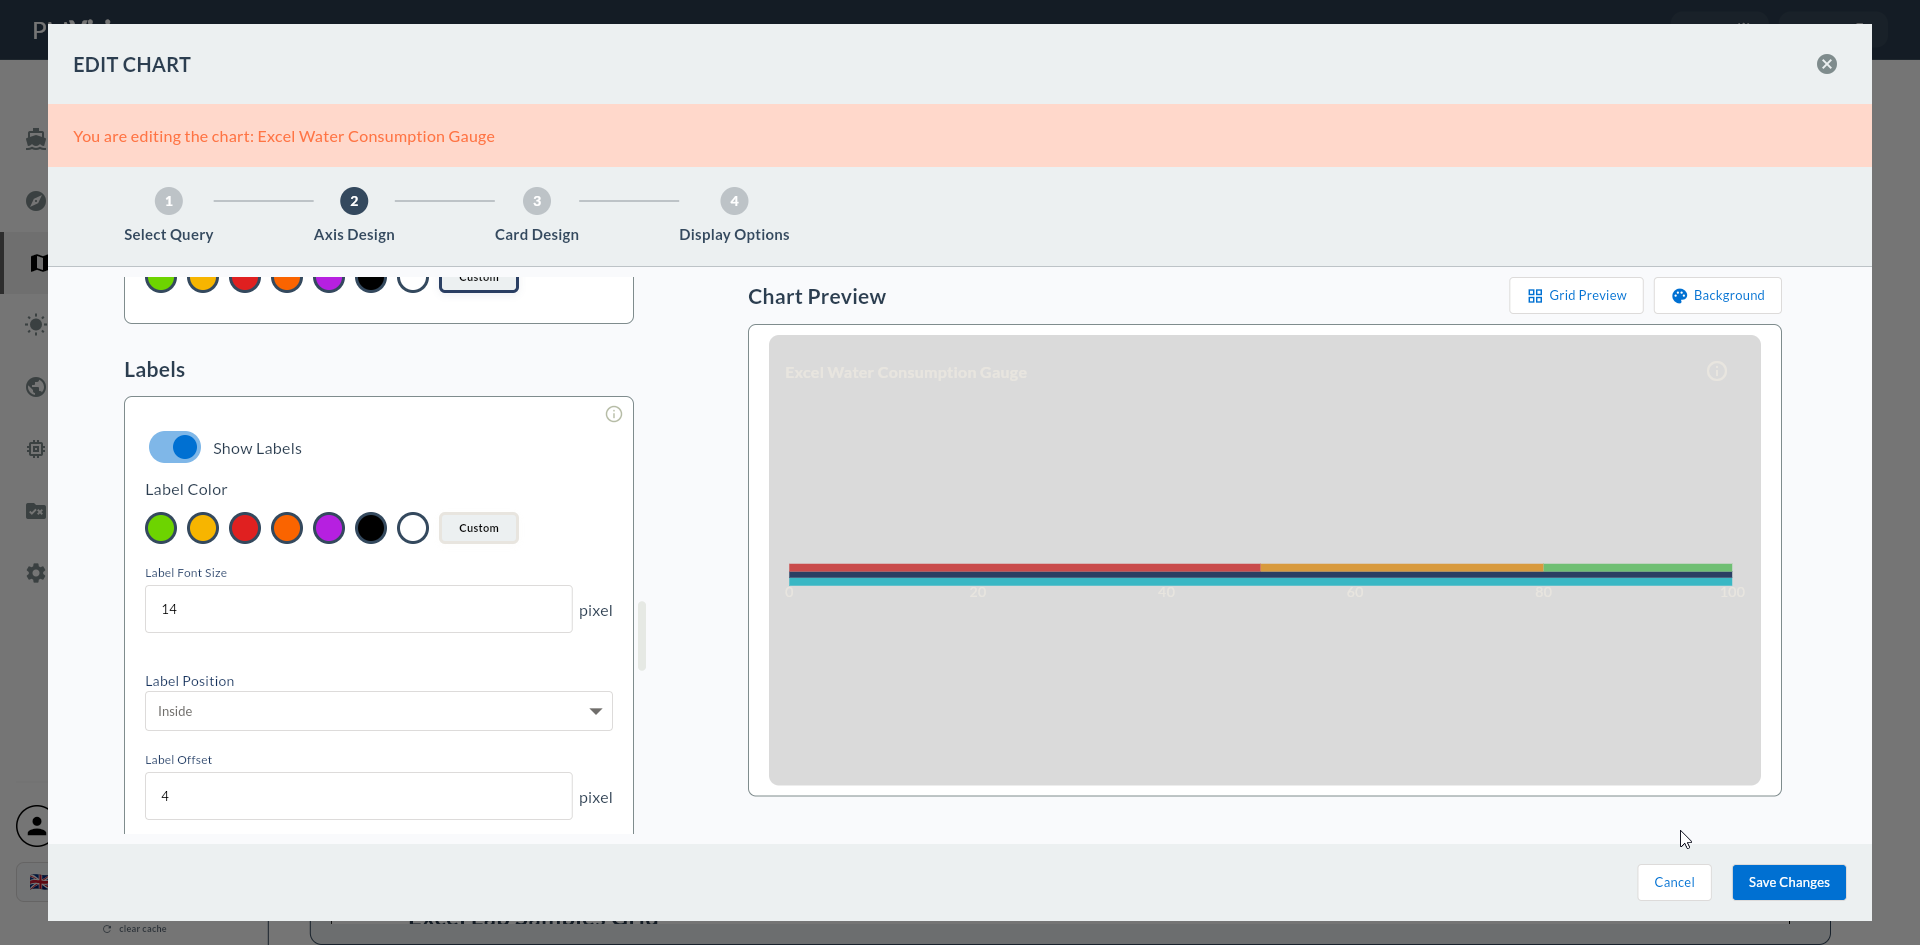
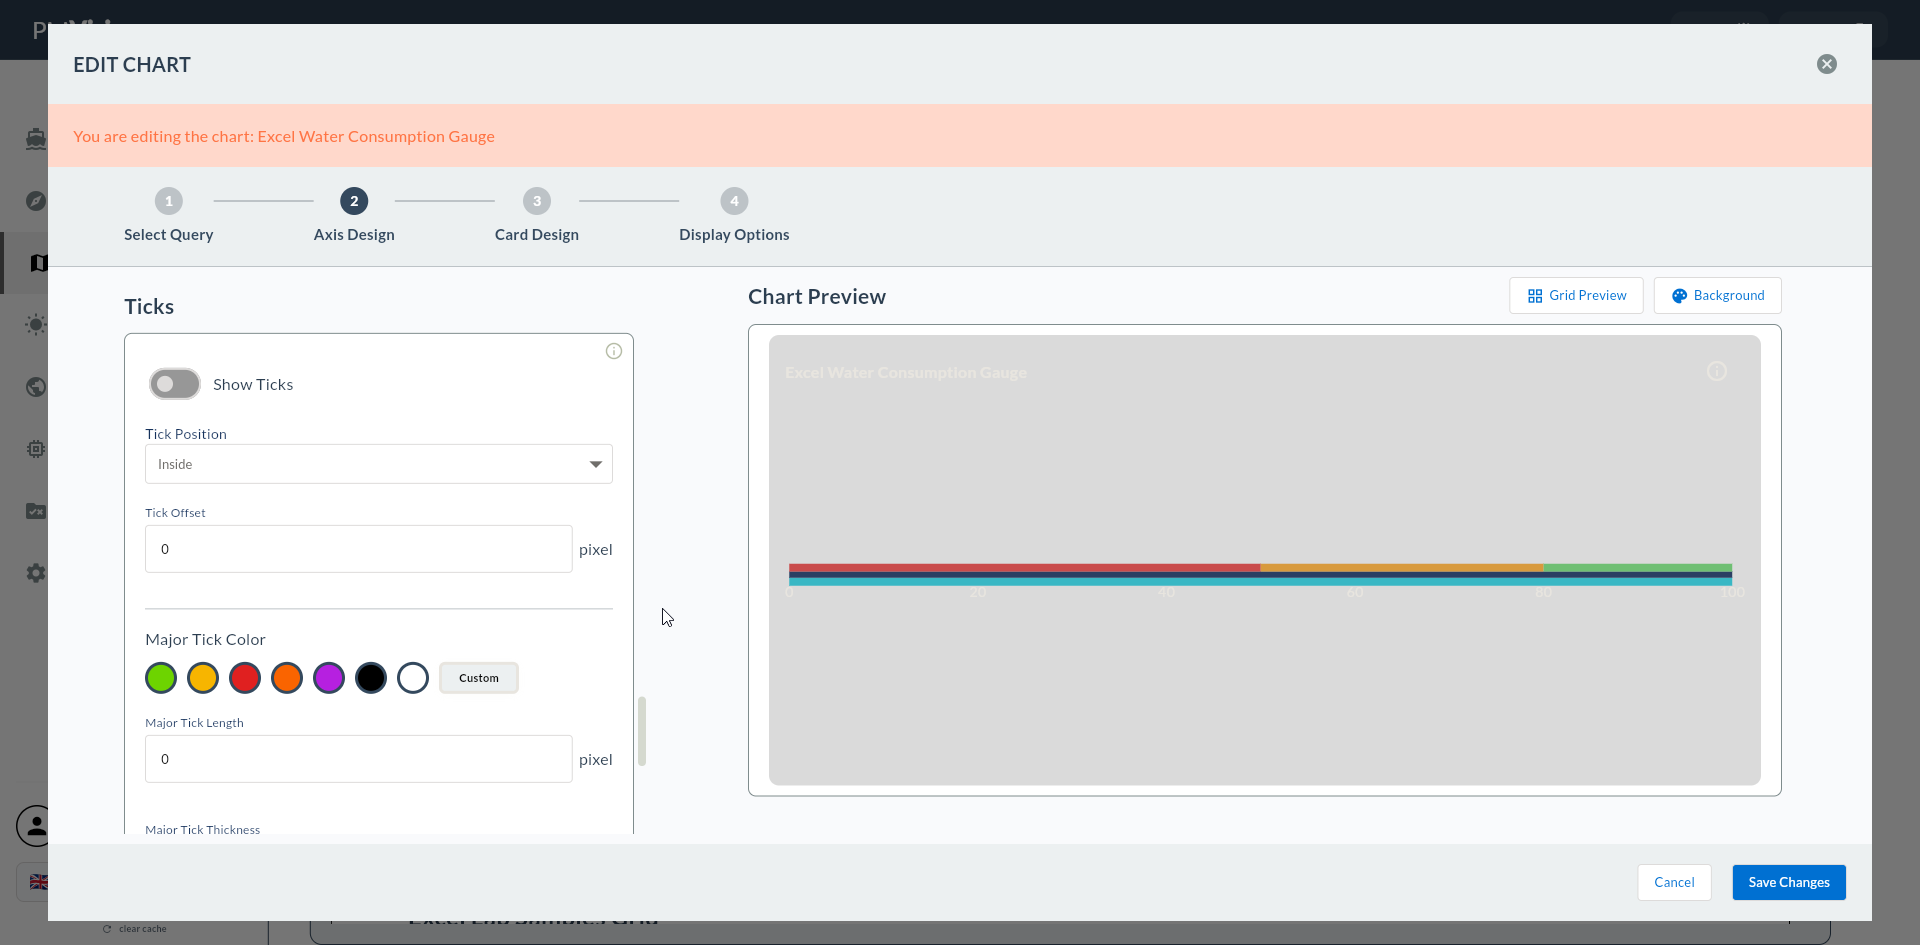
1. Screen Layout
The left side contains the configuration form; the right side shows a live gauge preview.
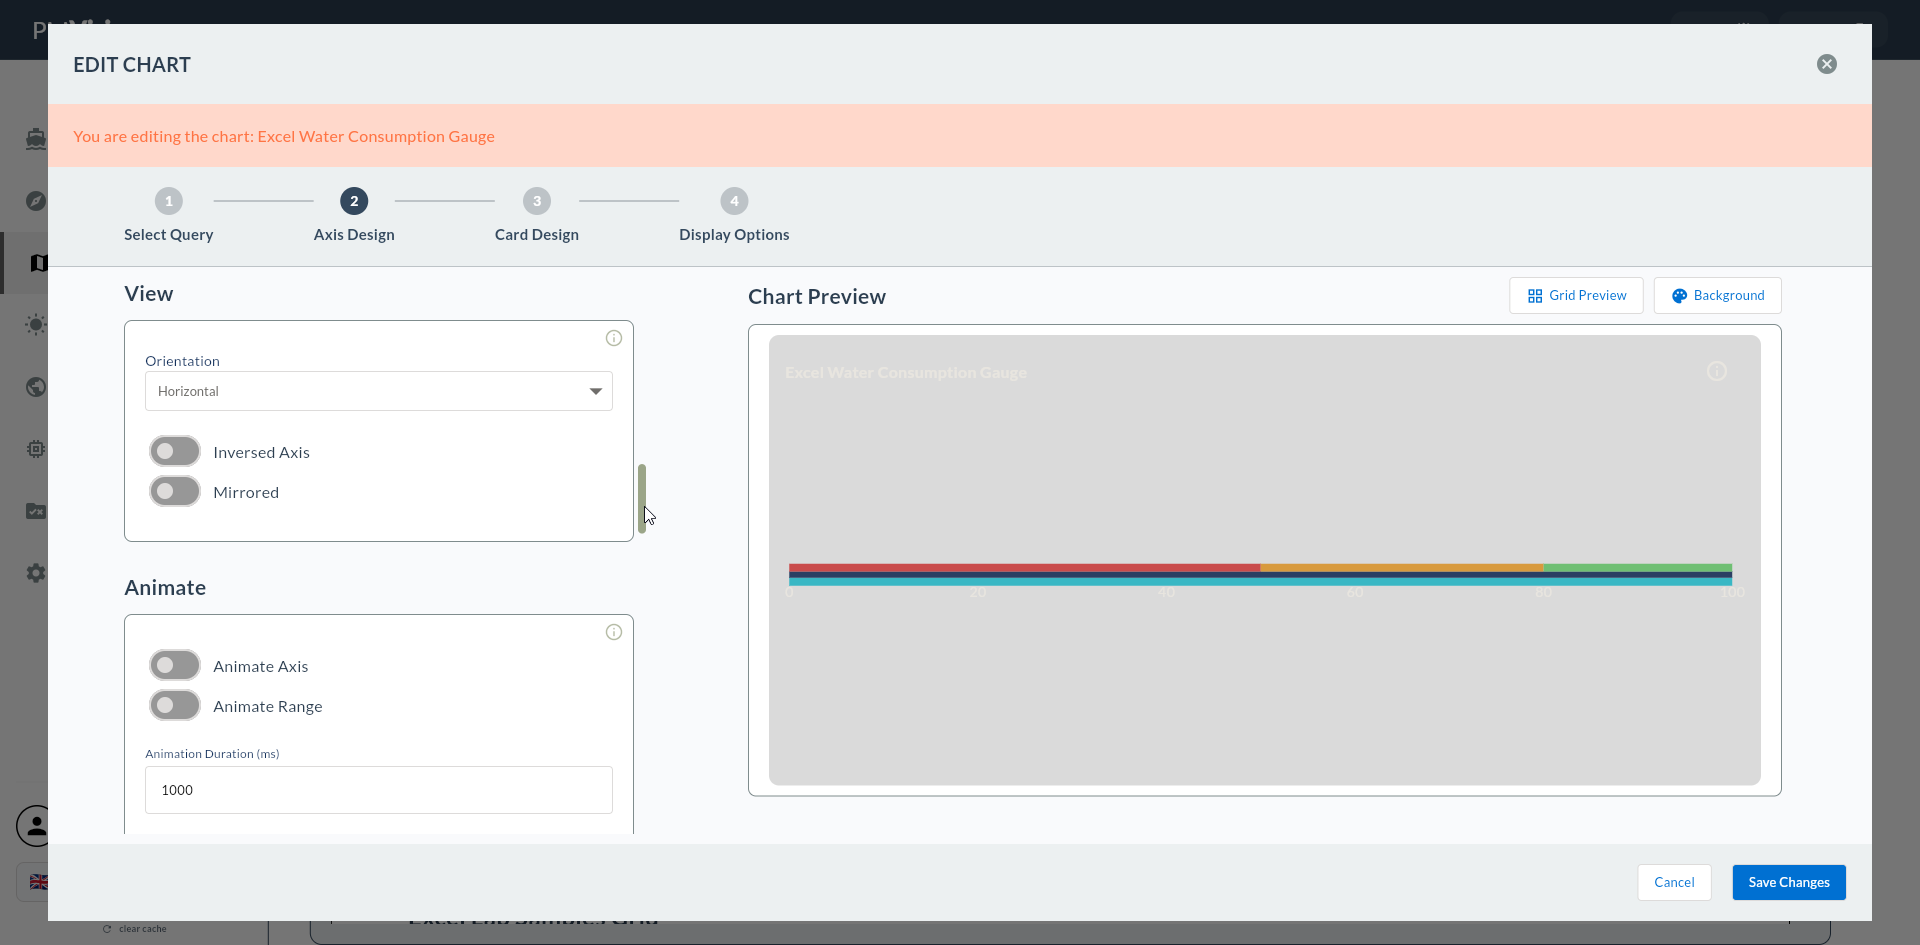
2. Orientation
| Field | Description | Possible Values |
|---|---|---|
| Orientation | Bar direction | Horizontal / Vertical |
Choosing Orientation
- Horizontal: Progress toward a target, annual plan progress.
- Vertical: Tank/fuel level, water reservoir fill.
3. Axis Range
| Field | Description | Example |
|---|---|---|
| Min Value | Starting point of the bar | 0 |
| Max Value | Full-scale point of the bar | 100 |
| Tick Interval | Scale mark spacing | 10, 20 |
| Label Format | Tick label format string | {0}%, {0} L |
4. Bar Pointer (Background Bar)
| Field | Description |
|---|---|
| Bar Color | Background bar color |
| Bar Width | Bar thickness (px) |
| Bar Border Radius | Corner rounding radius |
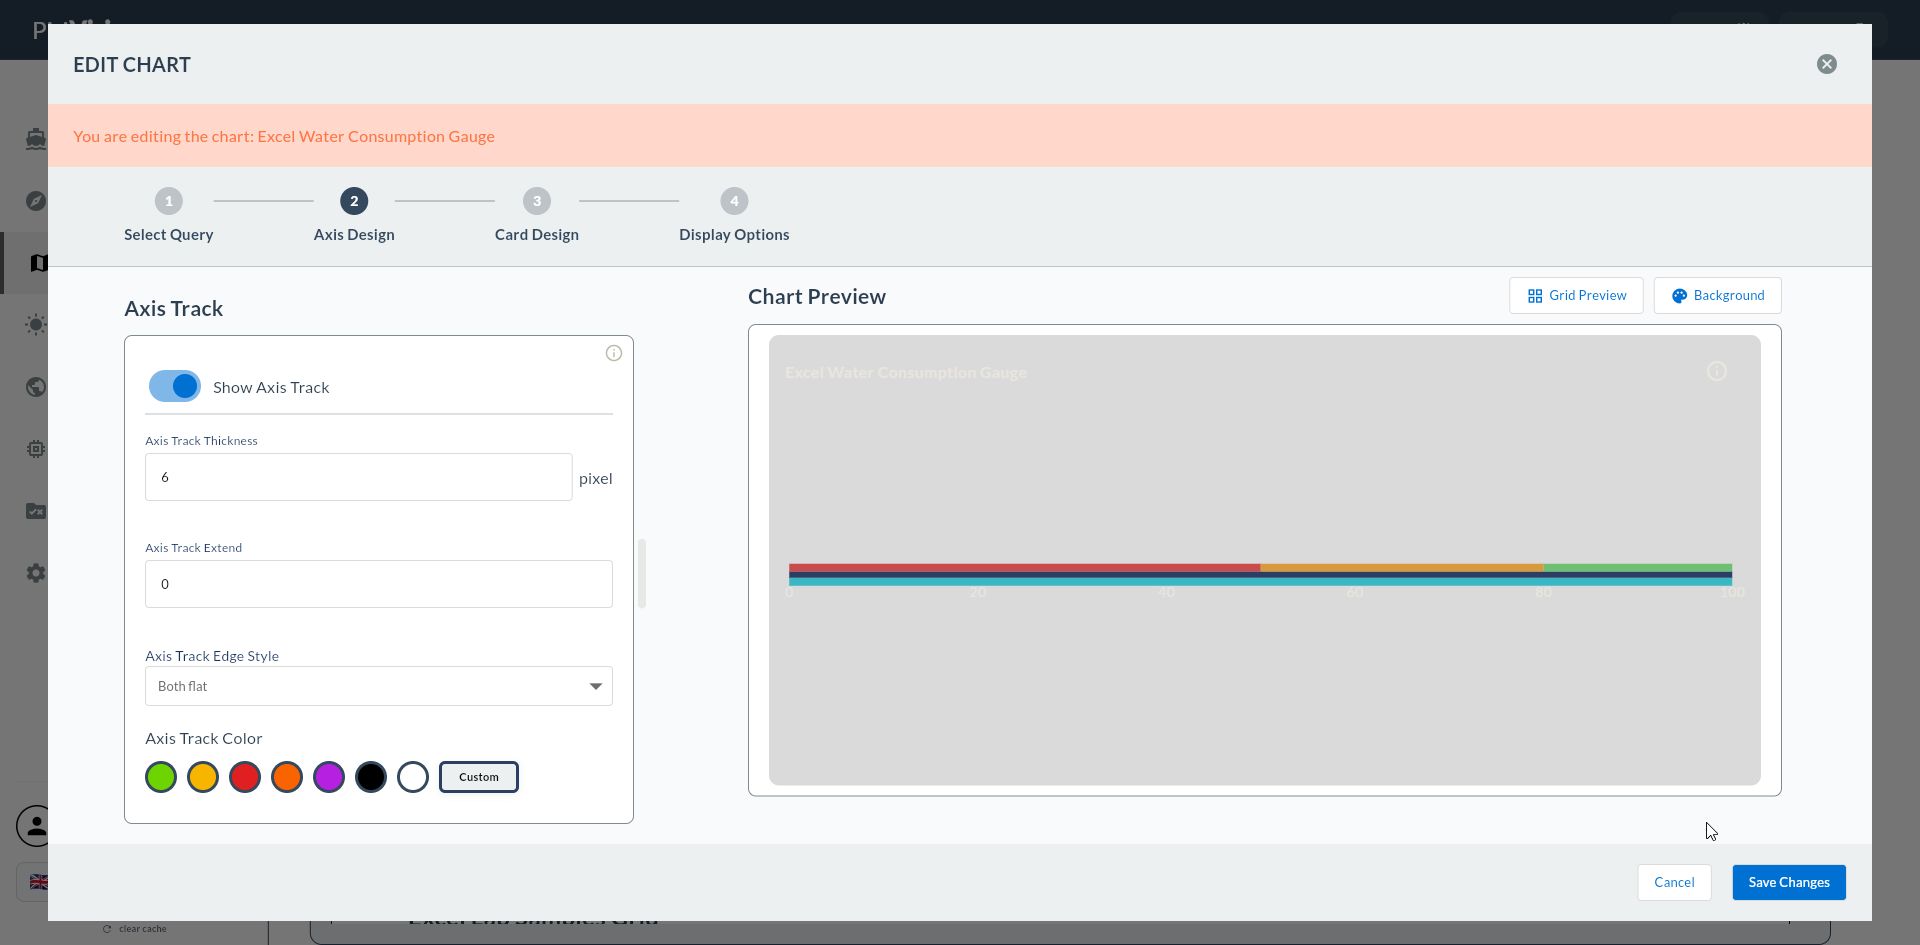
Bar Background
Set Bar Color to a light tone (e.g., #E5E7EB); when the marker is in a strong color (#1E40AF), good contrast is achieved.
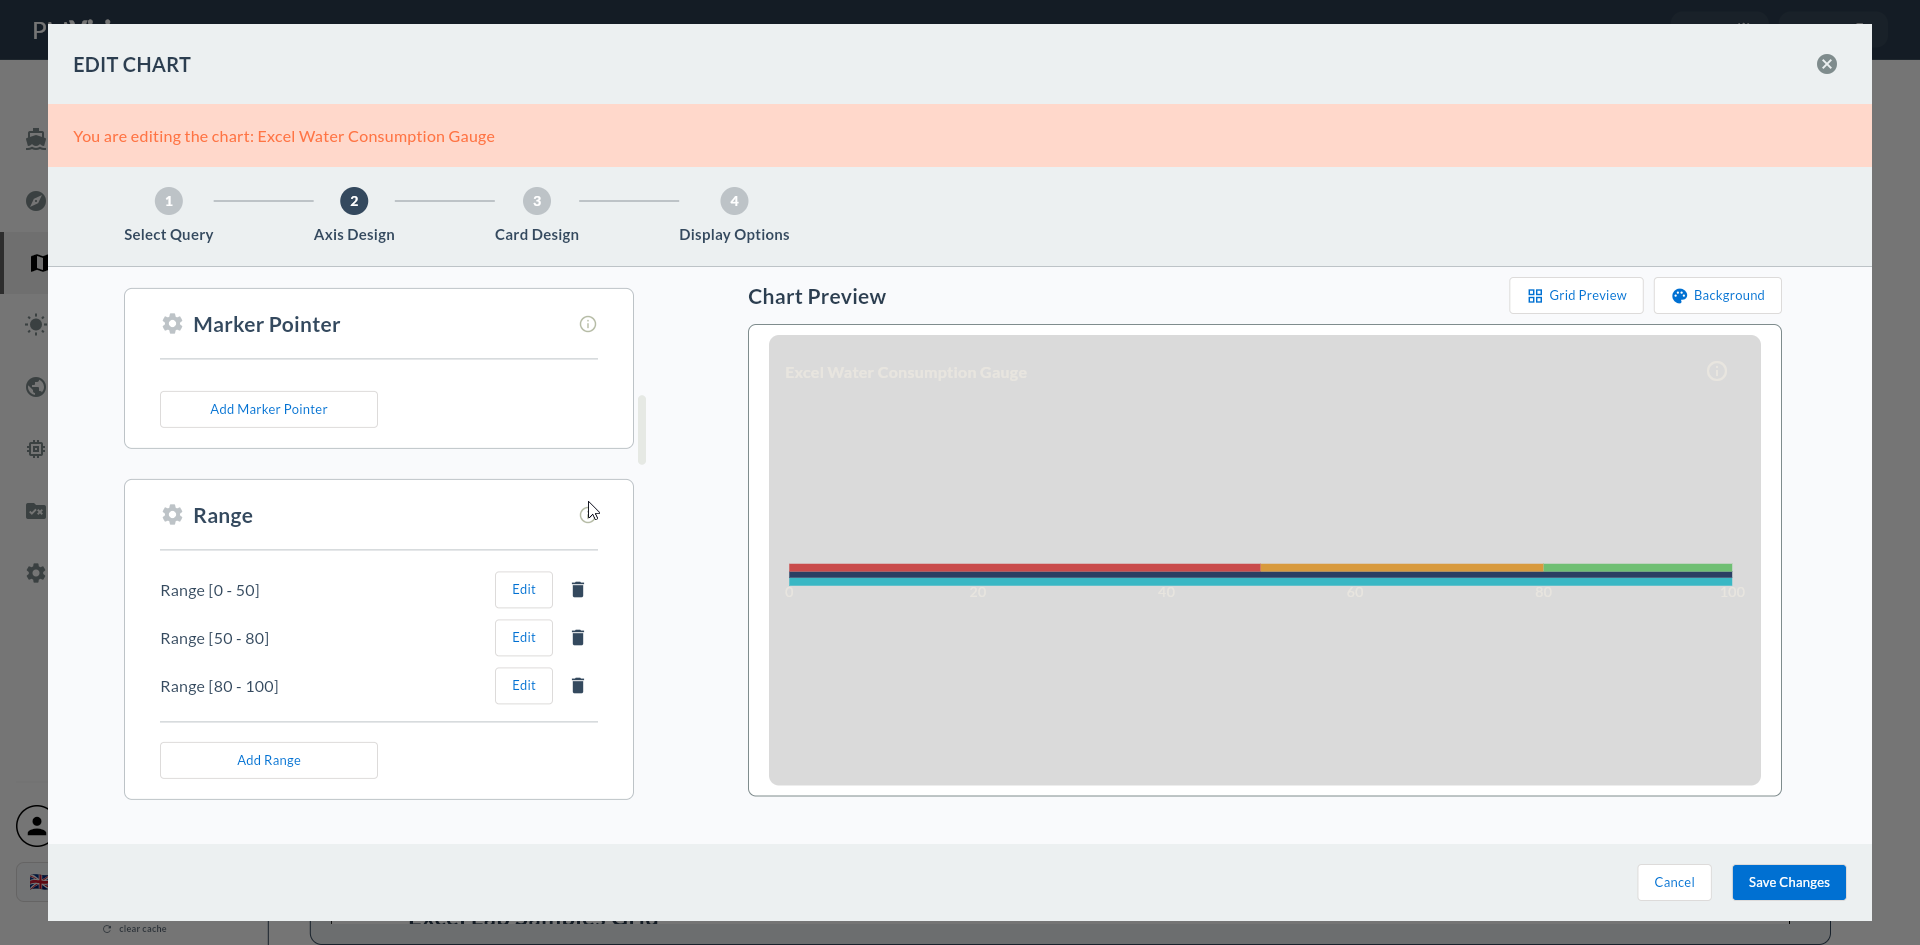
5. Marker Pointer (Current Value Indicator)
| Field | Description | Possible Values |
|---|---|---|
| Marker Type | Marker shape | Triangle, Arrow, Line |
| Marker Color | Marker color | color |
| Marker Size | Marker size | px |
Marker Types
- Triangle: Classic triangular arrow — clear on horizontal bars.
- Arrow: Points in the fill direction.
- Line: Thin line — minimal appearance.
6. Range Bands (Colored Zones)
Colored bands on the linear gauge bar highlight threshold zones.
| Field | Description |
|---|---|
| Band Min | Band lower bound |
| Band Max | Band upper bound |
| Band Color | Band color |
Multiple bands can be added. Typical configuration:
| Band | Min - Max | Color |
|---|---|---|
| Low | 0 - 30 | 🔴 Red |
| Normal | 30 - 80 | 🟢 Green |
| High | 80 - 100 | 🟡 Yellow |
7. Value Source
| Field | Description |
|---|---|
| Value Column | The numeric column from the Compass record that feeds the gauge |

If Value Source Is Left Empty
If this field is not filled, the Next button gives a warning.
8. Confirmation
When you click the Next button at the top right, flow.hasAxisDesign = true is marked and you go directly to Step 8 Card Design.
9. Next Step
5, 6, 7 Are Skipped
Because all visual settings for Linear Gauge are configured in this step, Series Design, Add Series, and General Design are skipped.