Area Series
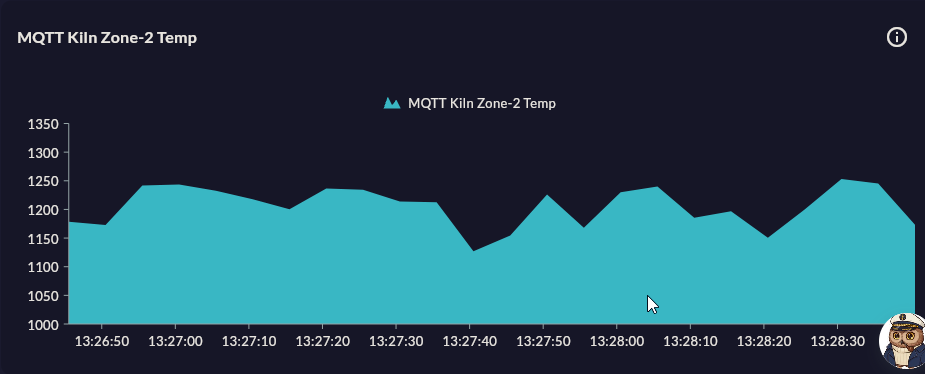
Area Series works like Line Series; the difference is that the area below the line is shown with a colored fill. This conveys both the trend and a sense of magnitude at the same time.
Prerequisite
This chart type can only be selected in step 2 of the Cartography Widget Wizard. If you have not started widget creation, start the wizard first; an appropriate Compass record is also required.
Use Cases
| Scenario | Data Type | Why This Chart |
|---|---|---|
| Tank fill level | Time series, % or m³ | Filled area enhances volume perception |
| Cumulative production count | Time series, pcs | Accumulation becomes visually prominent |
| Energy accumulation (kWh) | Time series, kWh | Daily/weekly accumulation trend |
| Air flow | Time series, m³/h | Presents flow magnitude with visual emphasis |
| Wastewater volume | Time series, L/min | Tracking discharge peaks |
Data Requirements
| Column | Type | Description | Required |
|---|---|---|---|
| X axis | datetime or string |
Timestamp or category label | Yes |
| Y axis | numeric |
Measurement value | Yes |
Negative values
If the Y axis goes below zero, the fill area forms in both directions. This is usually not desirable; for metrics that may be negative, use Line Series.
Specific Configuration
| Setting | Values | Description |
|---|---|---|
| Fill opacity | 0.0–1.0 | Transparency of the colored area; 0.3–0.5 looks good in most themes |
| Gradient fill | On / Off | When on, the color fades top-to-bottom |
| Marker visibility | On / Off | Same marker settings as Line apply |
| Line thickness | 1–6 px | Area border line thickness |
Tips
Multiple overlapping series
When two or more Area series are added, the area of the first added series ends up under the next and may be hidden. In that case use Stacked Area; each series area is shown separately.
Keep opacity low
Even with a single series, keeping opacity below 0.4 makes data labels and grid lines easier to read.
Many series
More than 3 Area series creates visual clutter. In that case prefer Stacked Area or Line Series.
9-Step Summary — Area Series
Area Series uses the Standard Cartesian flow.
| # | Step | Key point for Area | Details |
|---|---|---|---|
| 1 | Group Selection | Cartesian | → |
| 2 | Chart Type | Area Series card | → |
| 3 | Compass Record | SQL/REST/MQTT/Excel — ordered X column | → |
| 4 | Axis Config | X: DateTime/Numeric, Y: Numeric | → |
| 5 | Series Design | Fill Opacity, Marker, Stroke Width | → |
| 6 | Add Series | Multiple series with secondary Y axis | → |
| 7 | General Design | Tooltip, Y Axis Suffix | → |
| 8 | Card Design | Refresh: 30-60s (SQL), 0 (MQTT) | → |
| 9 | Display | Name, Tags, Folder | → |
→ Standard Cartesian Flow overview